Ford Motor Company's management explains the business in its own materials. The slides below do the most of that work, pulled from the documents preserved in Sources. Each source link opens the complete presentation at that slide in a new tab.
The newest and fullest current picture: the Ford+ operating map, all four segments, first-half results, and raised 2026 guidance. · Open the full document →
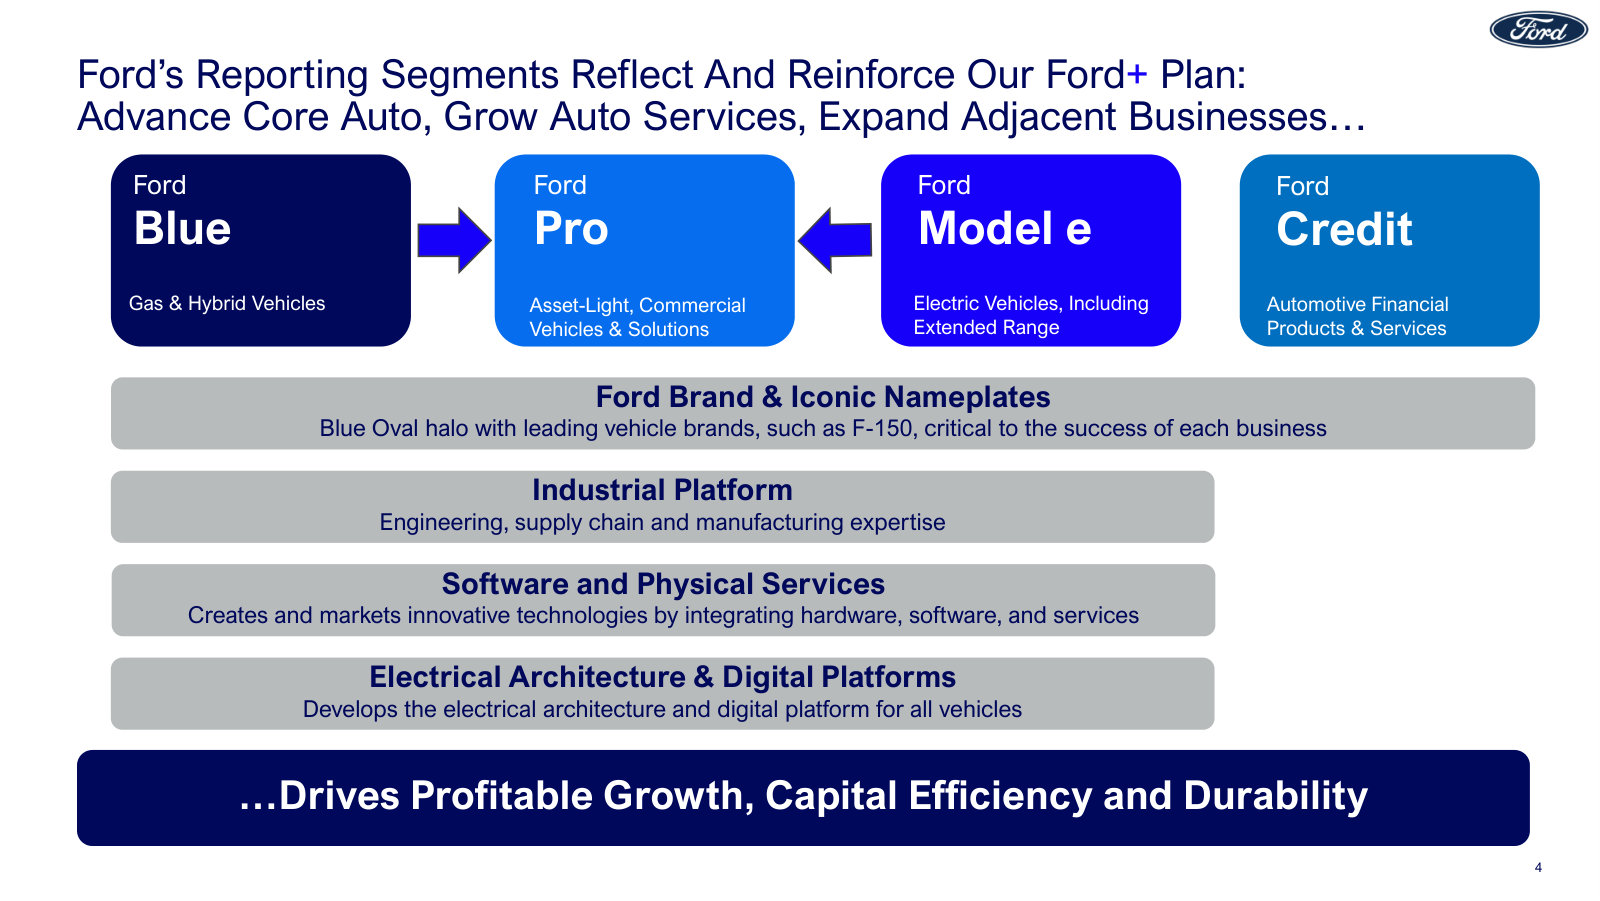
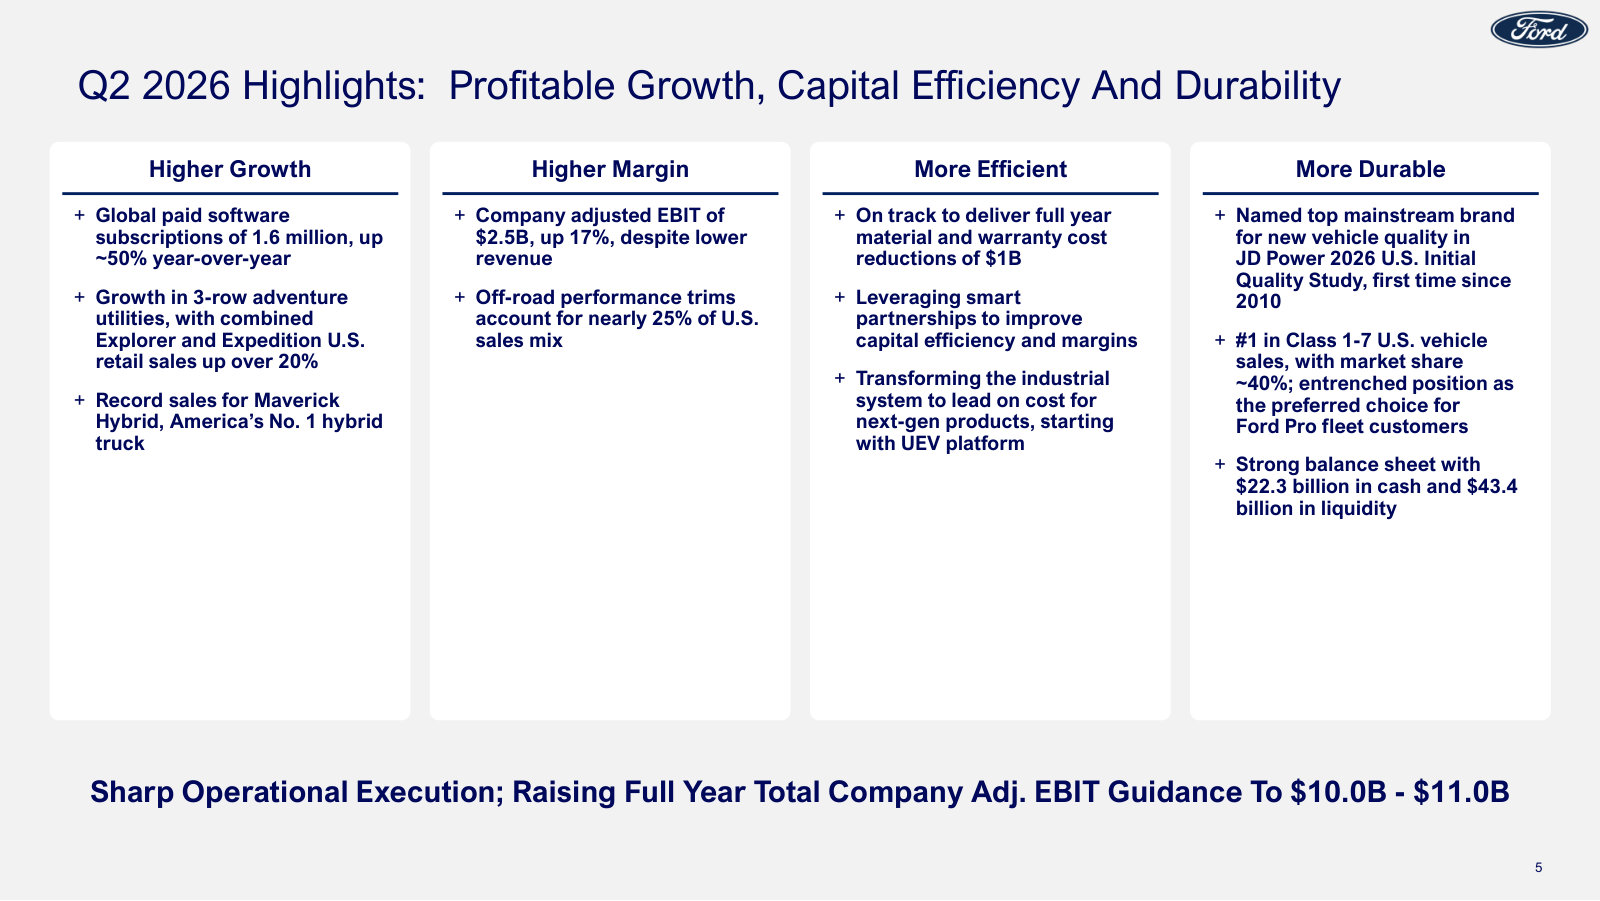
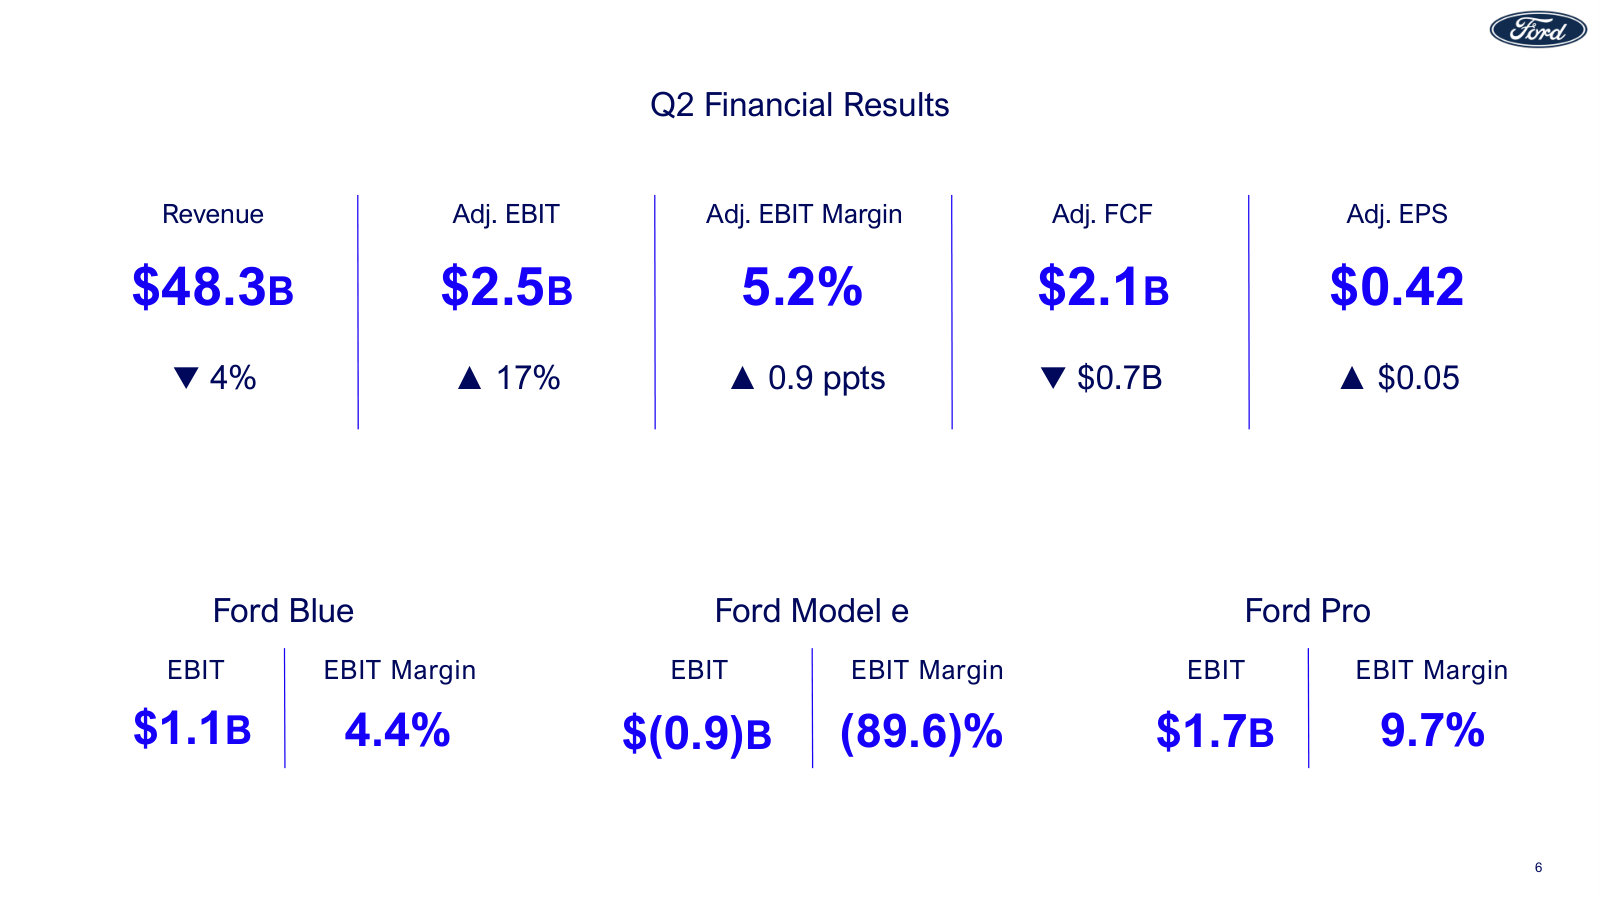
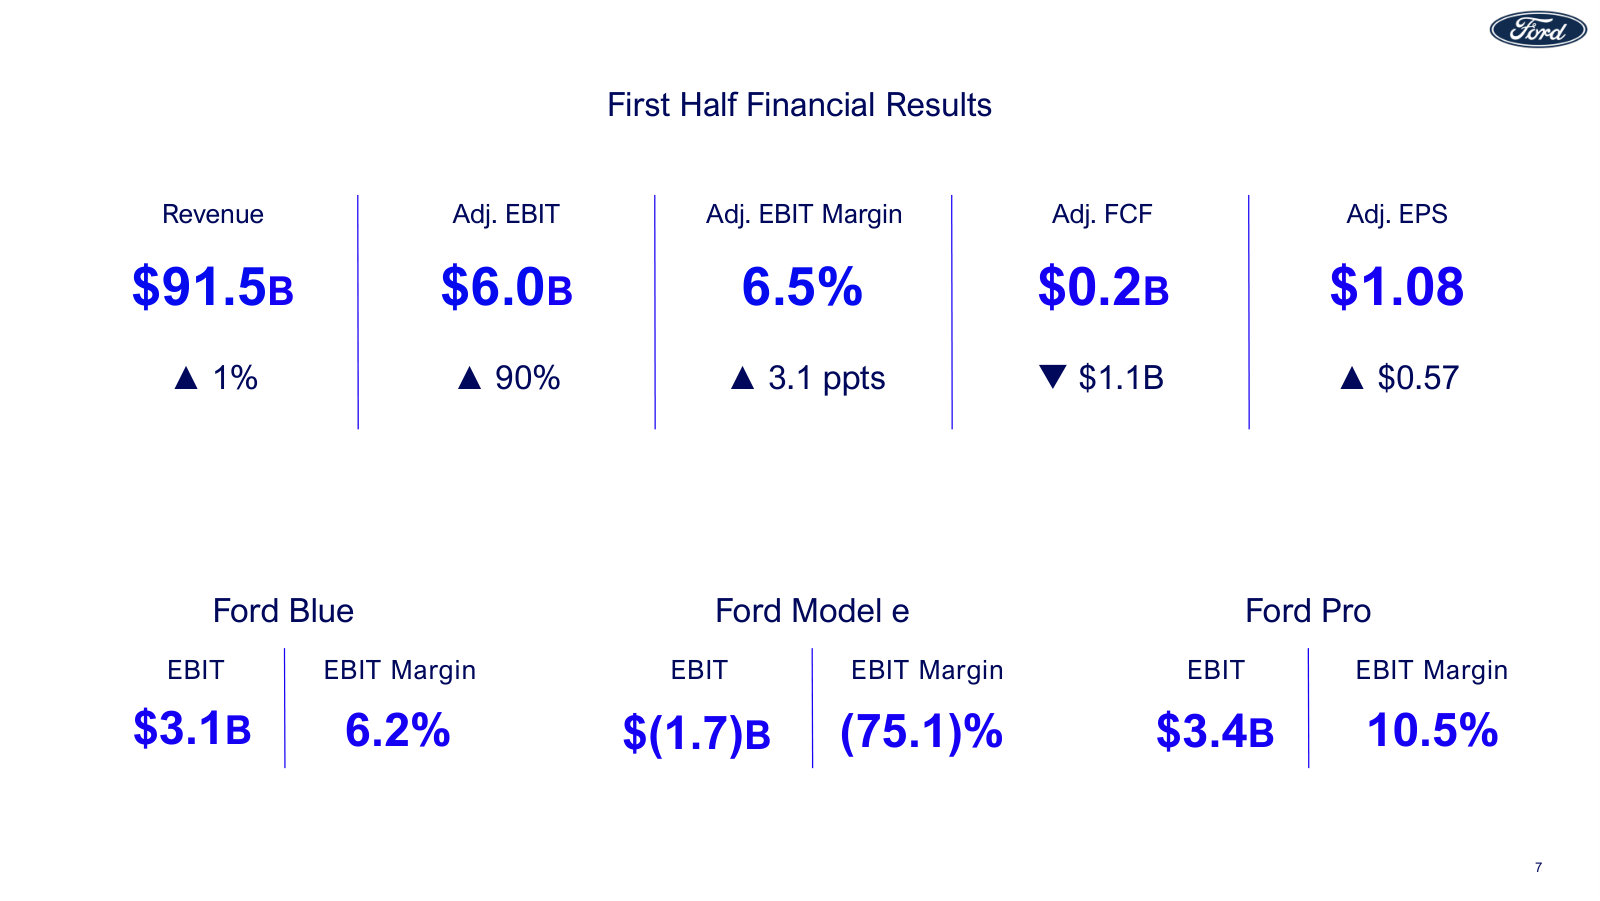
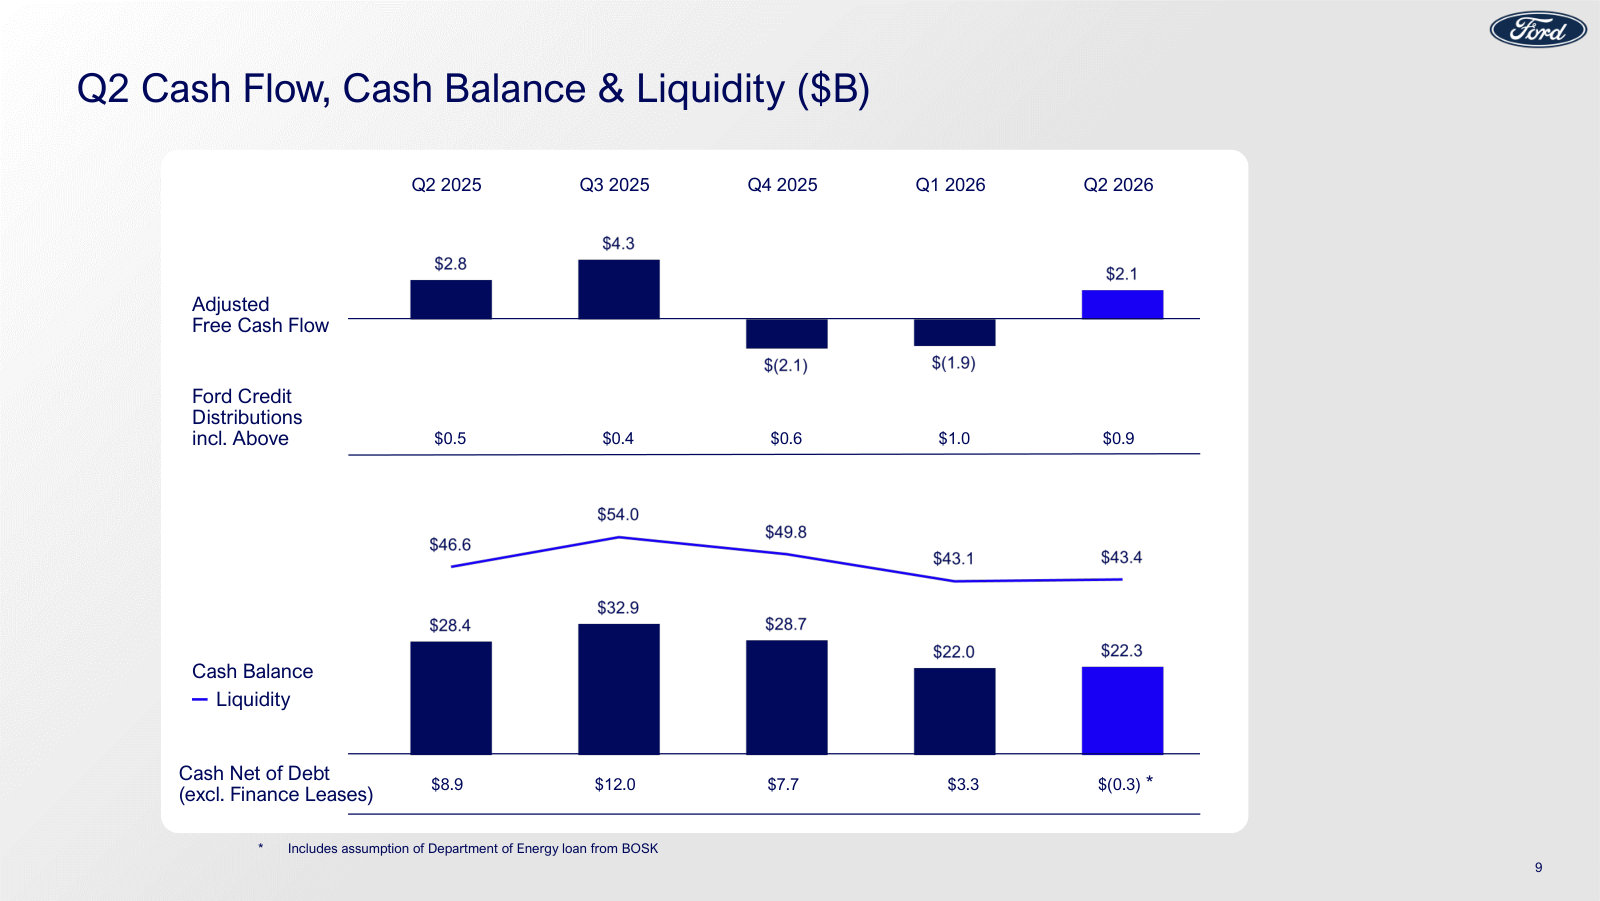
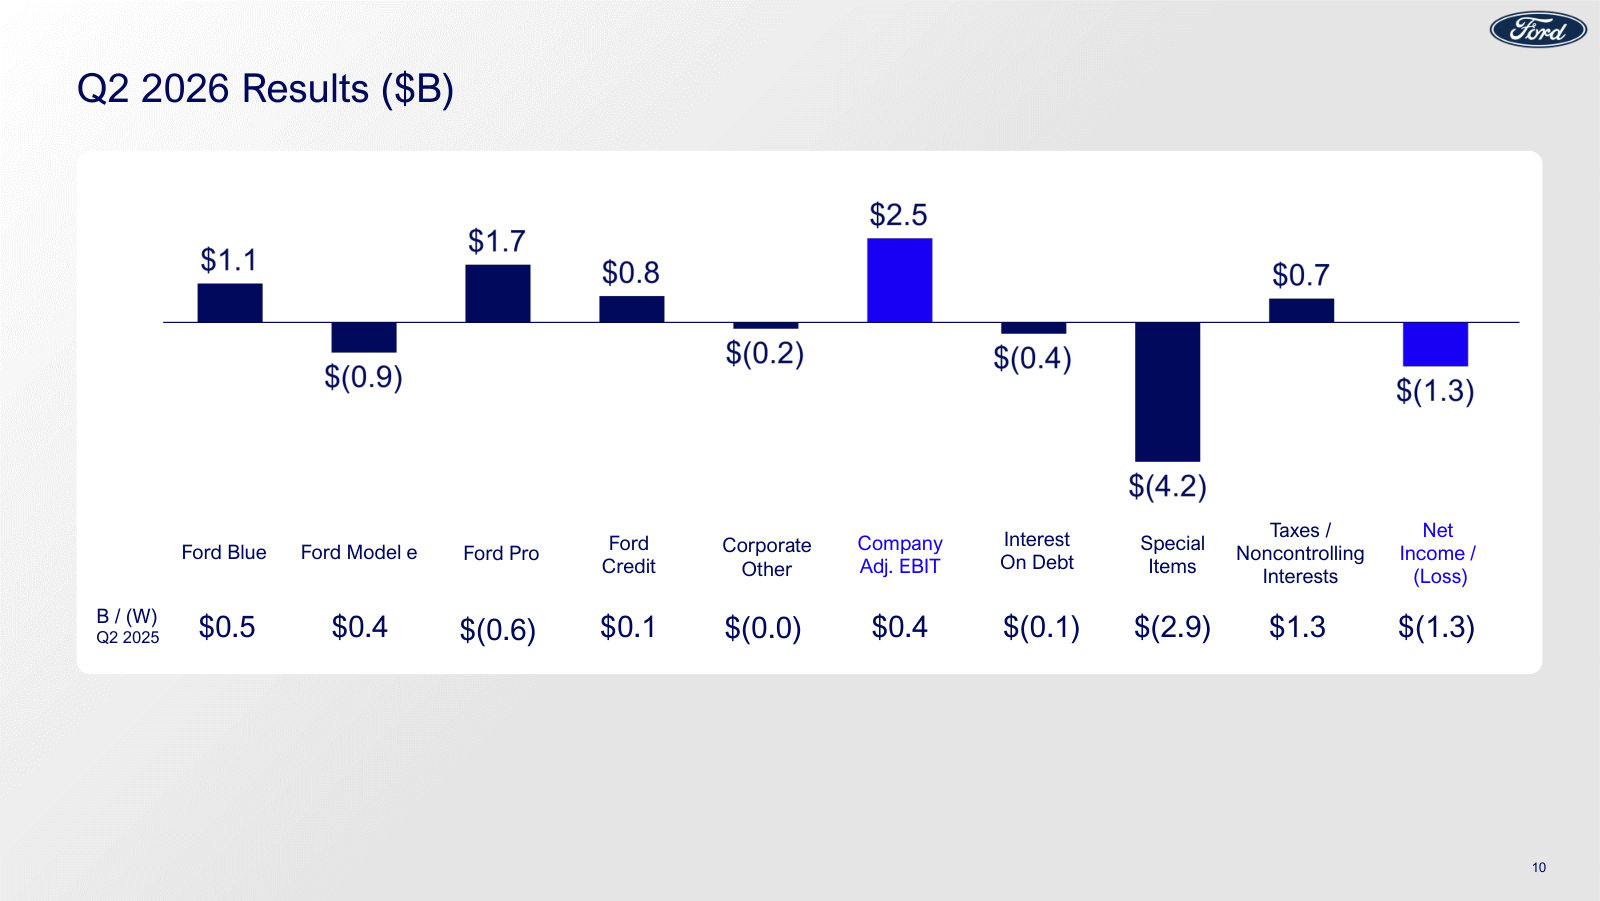
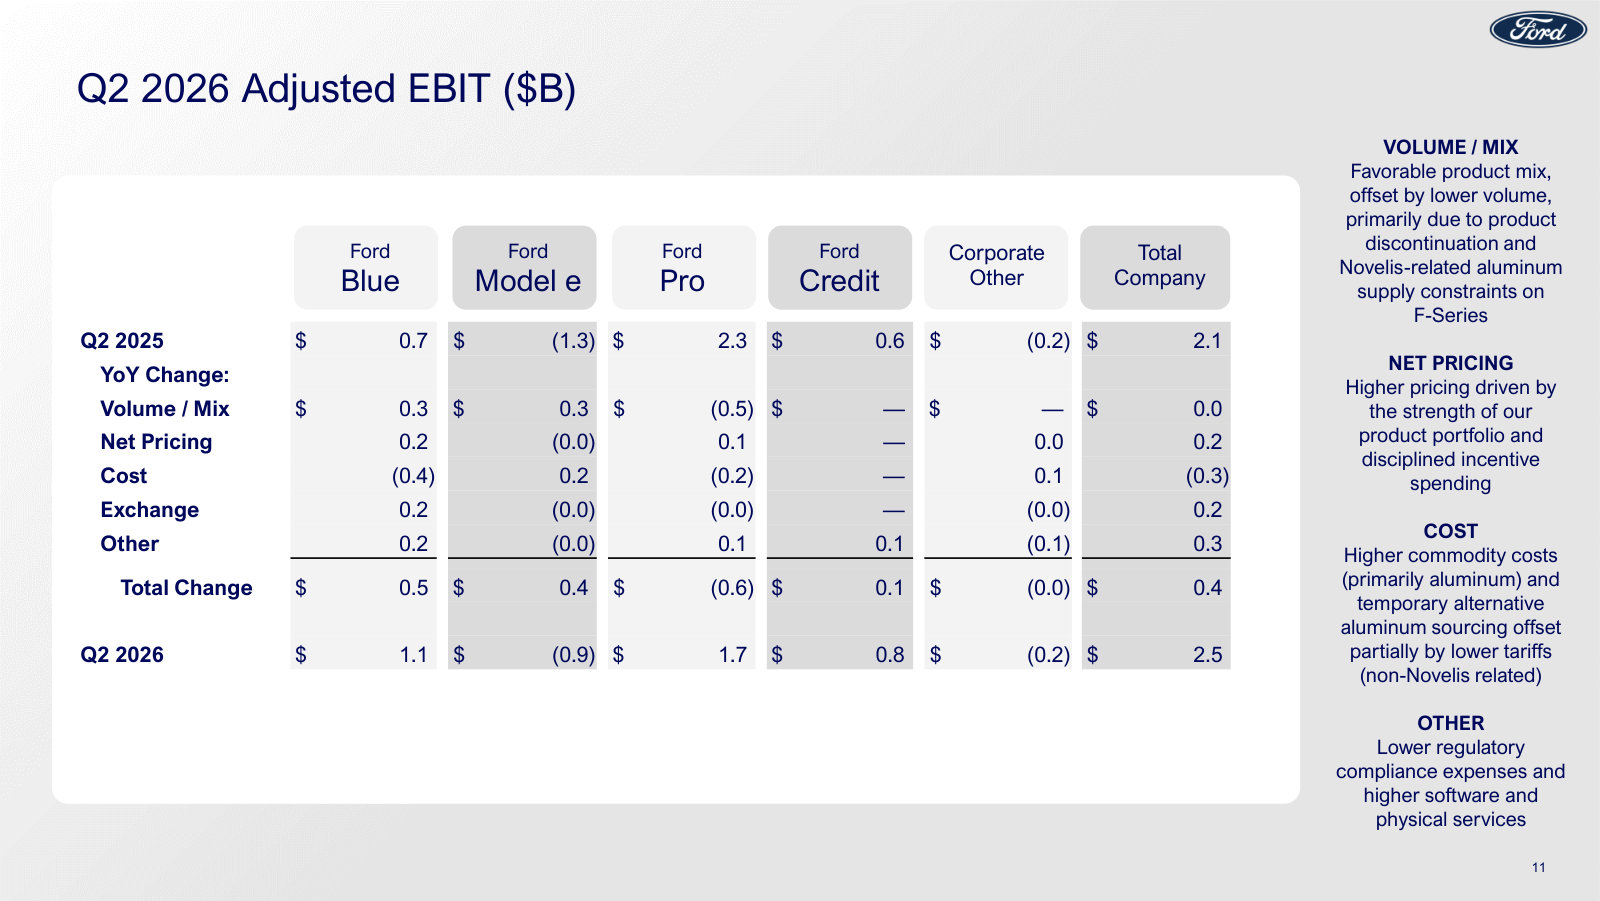
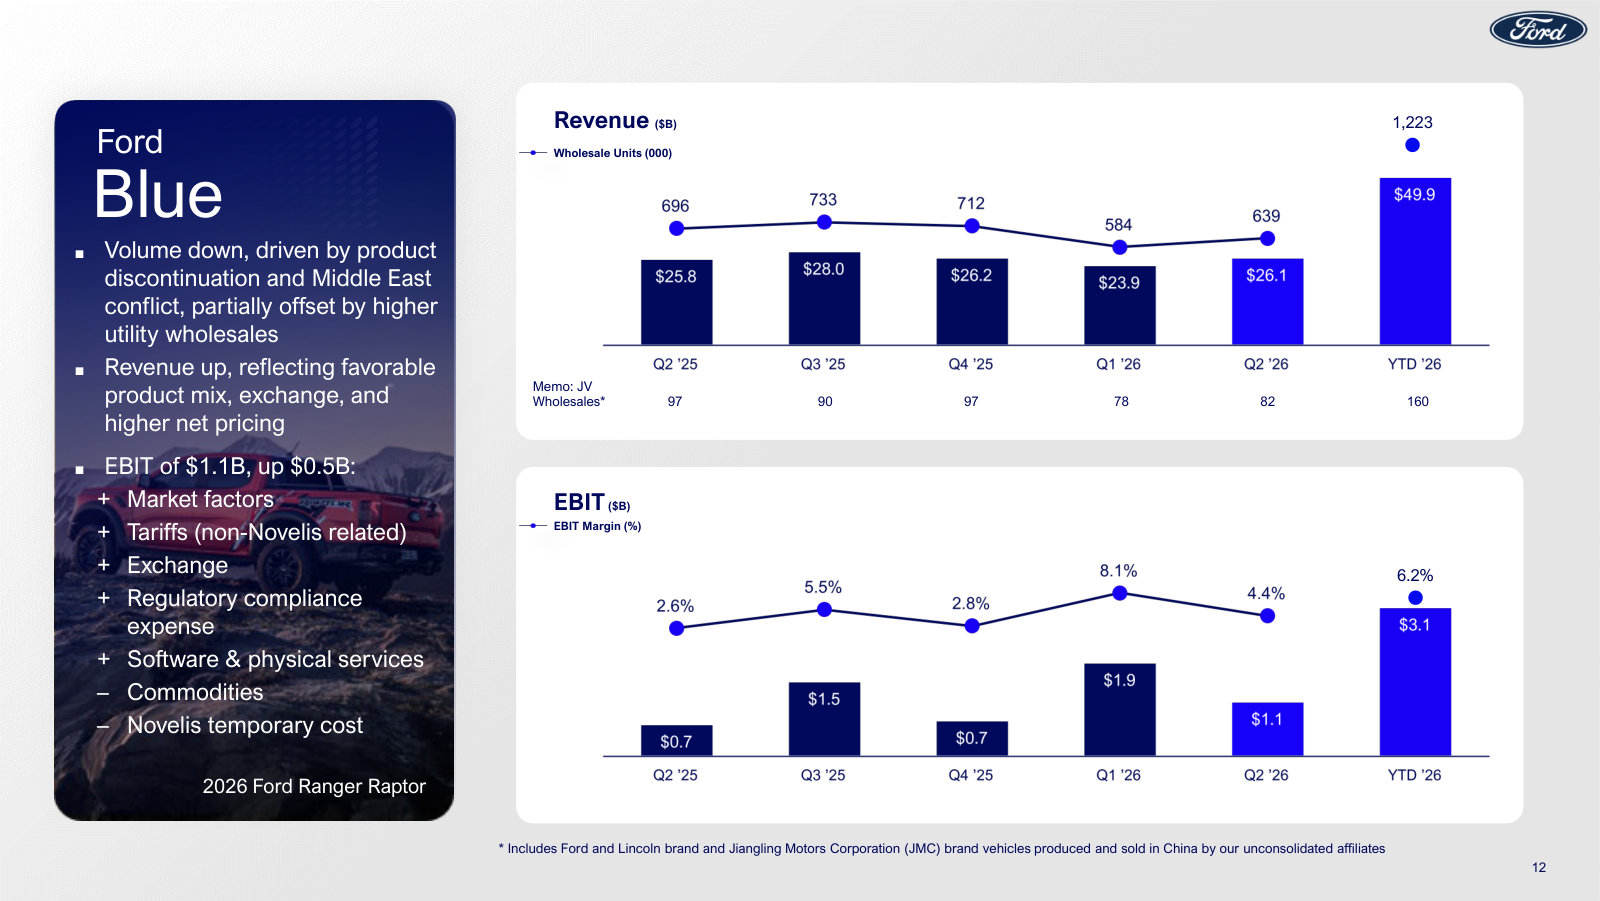
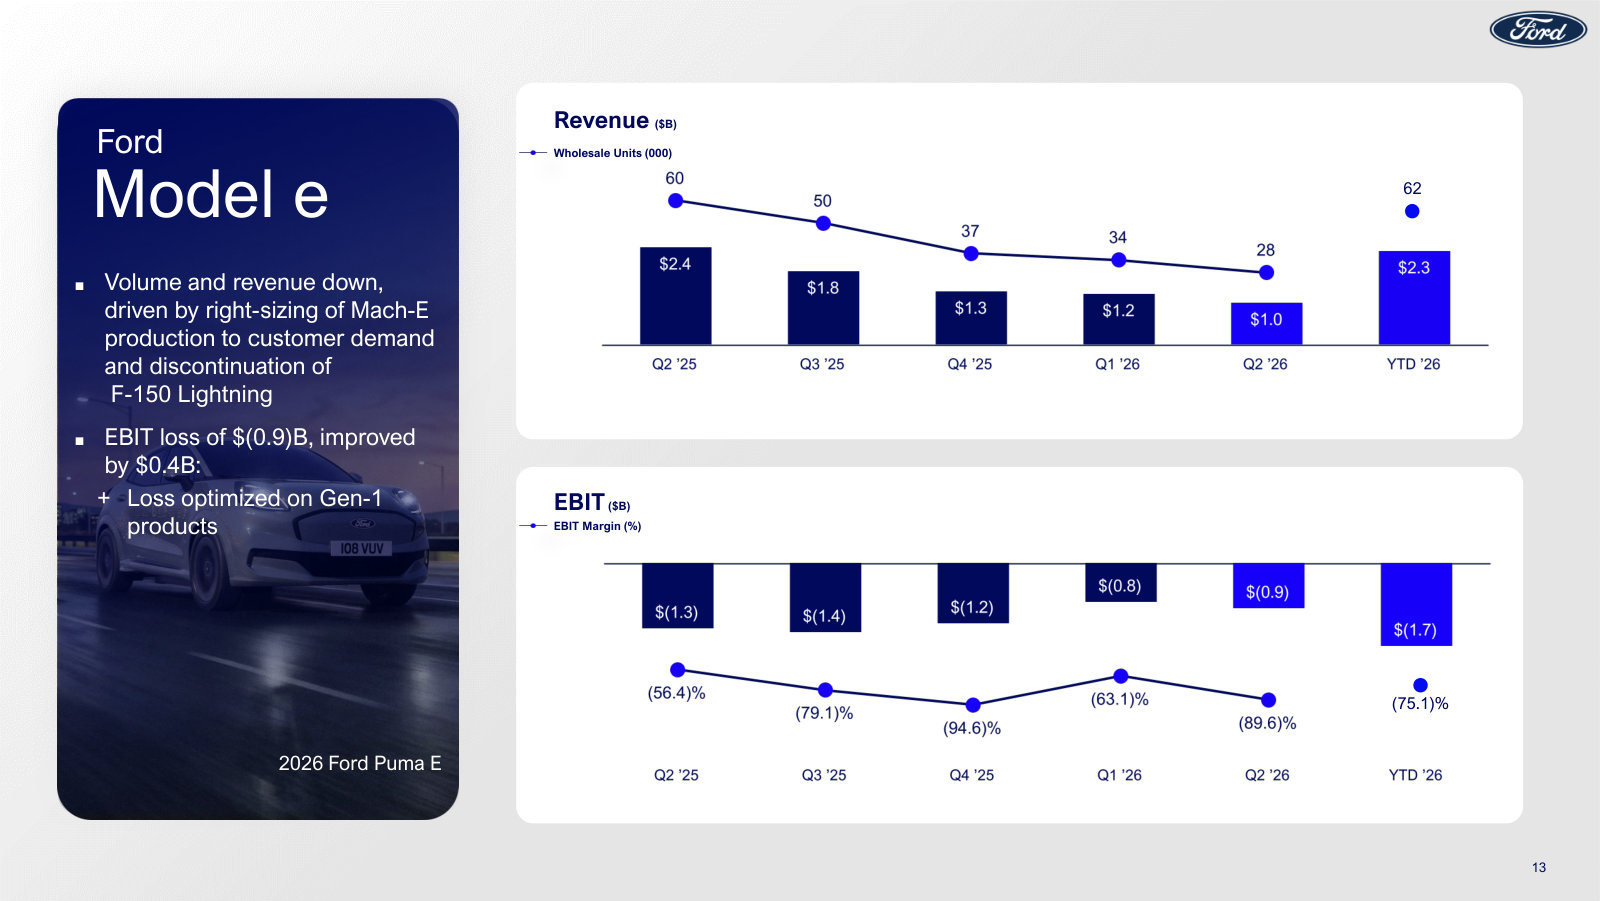
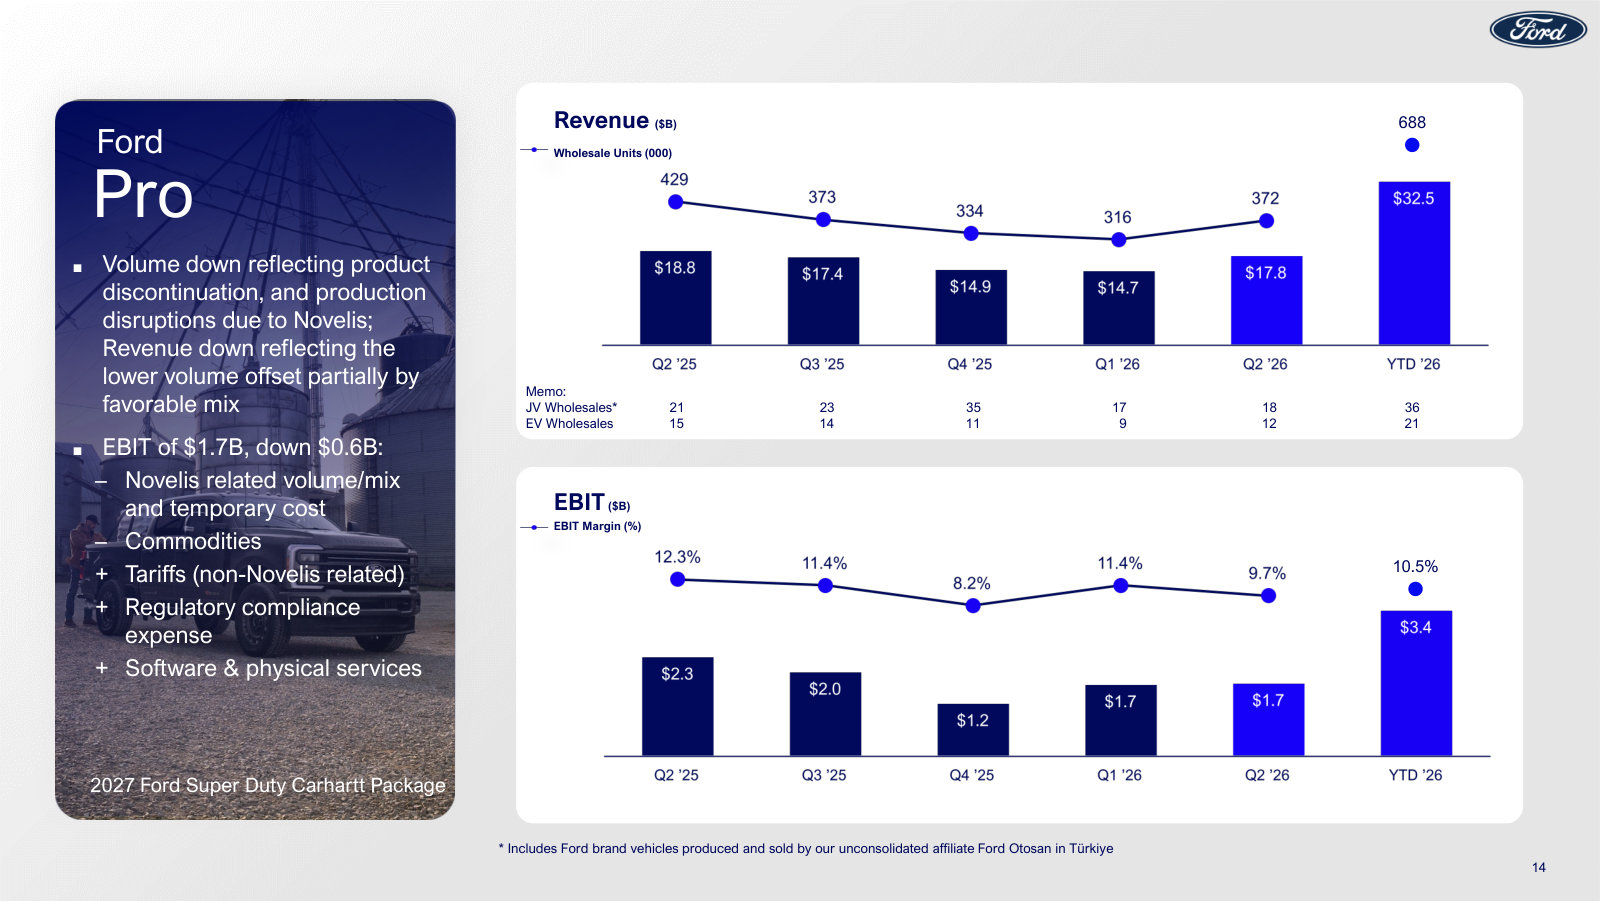
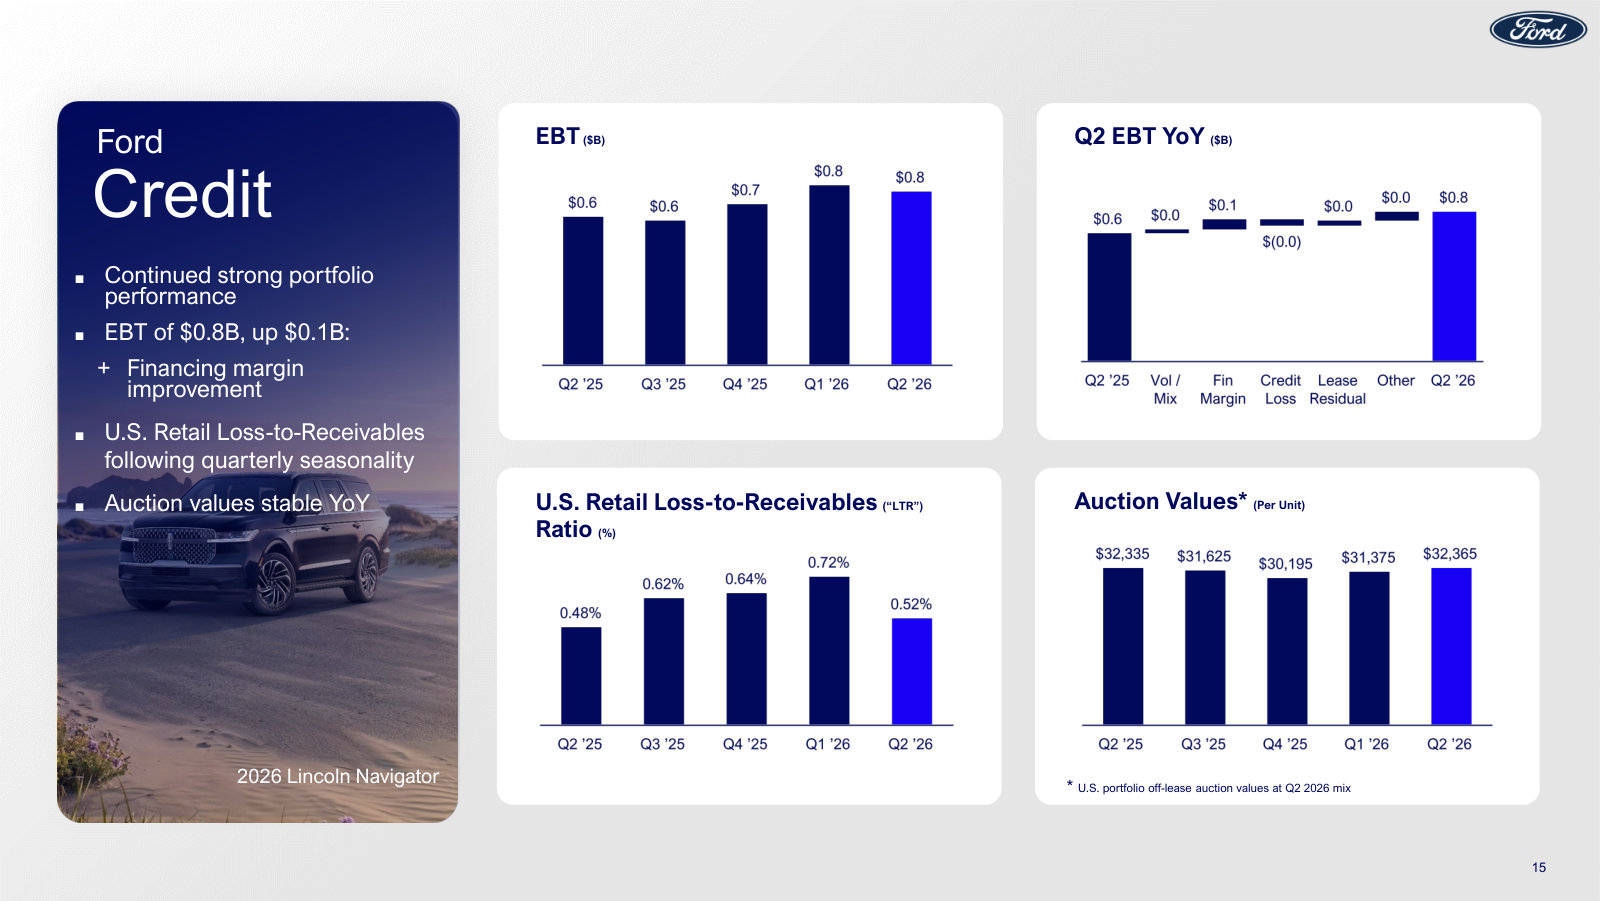
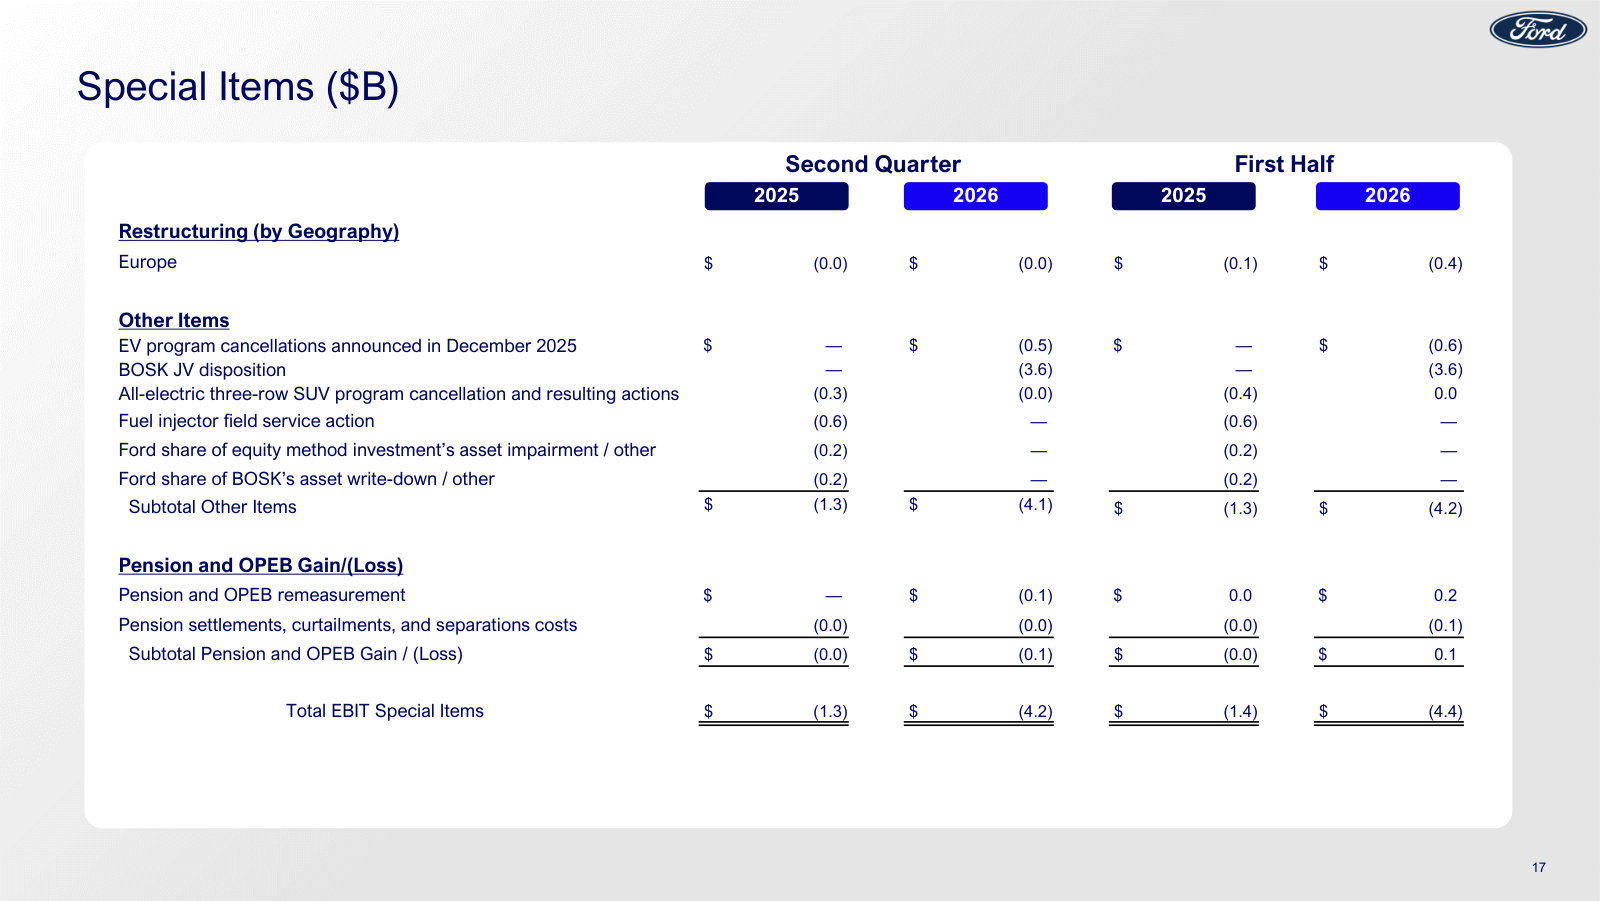
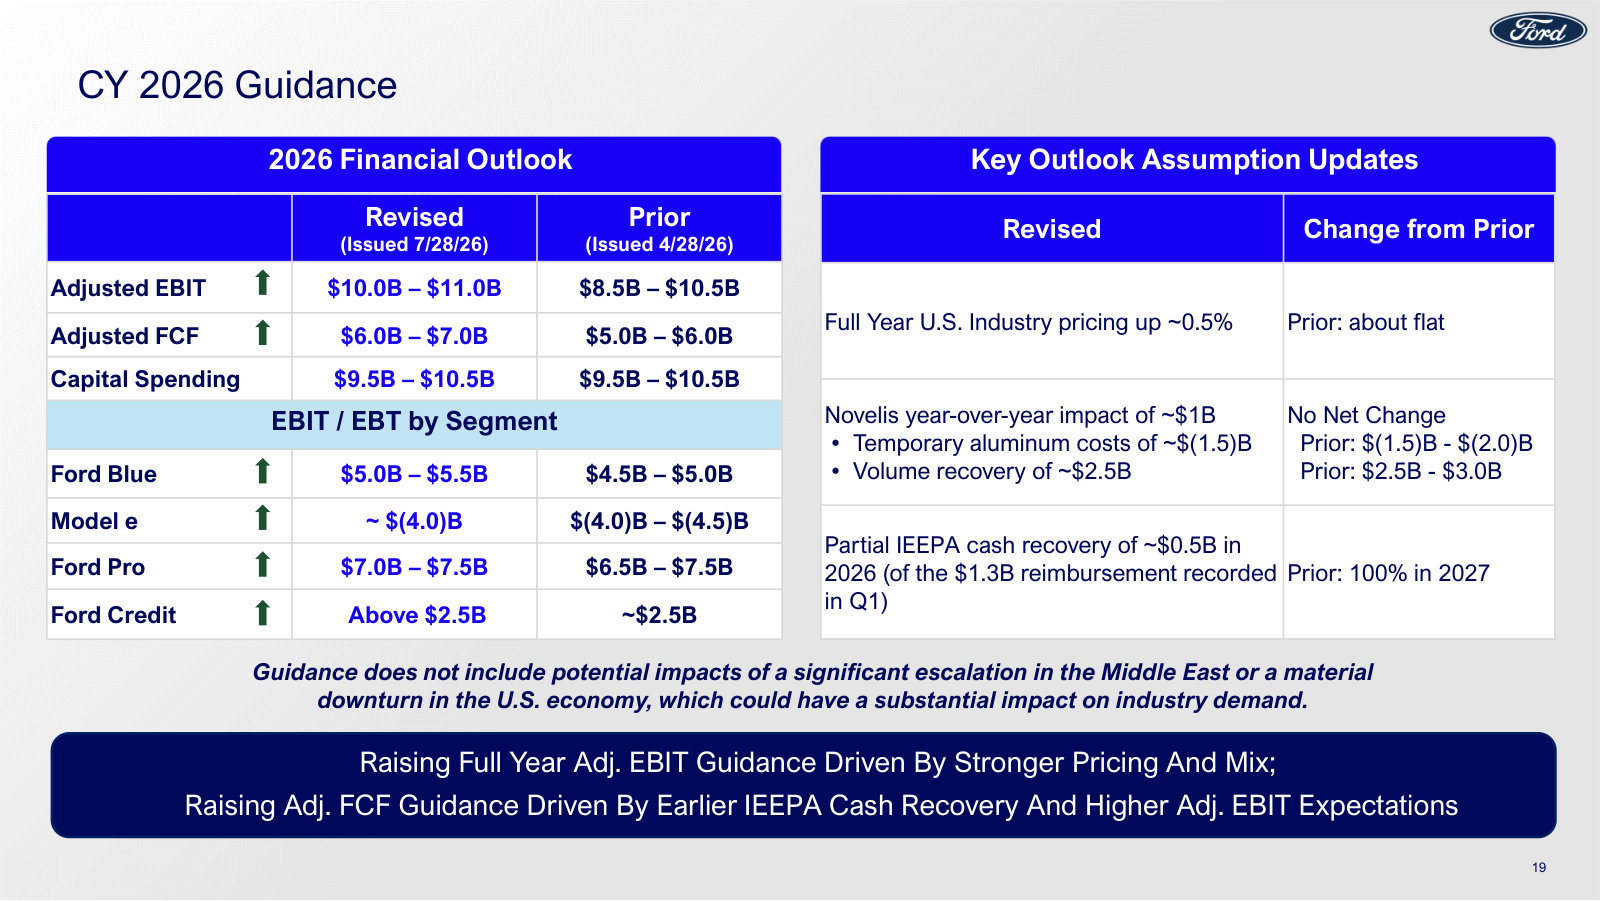
p. 4 — The Ford+ operating map: Blue (gas/hybrid), Pro (commercial), Model e (EV) and Ford Credit on shared brand and industrial platforms. · Open the full presentation →p. 5 — How management scores itself — growth, margin, efficiency, durability — with full-year adjusted EBIT guidance raised to $10.0–11.0B. · Open the full presentation →p. 6 — Q2 in one screen: $48.3B revenue, $2.5B adjusted EBIT, and EBIT by segment — Blue and Pro profitable, Model e still a loss. · Open the full presentation →p. 7 — First-half 2026 totals — $91.5B revenue and $6.0B adjusted EBIT, up 90% year over year — the cleaner run-rate view. · Open the full presentation →p. 9 — Five quarters of free cash flow, cash balance and liquidity; cash-net-of-debt swings to slightly negative after assuming the BOSK DOE loan. · Open the full presentation →p. 10 — The bridge from segment EBIT to net loss: $2.5B adjusted EBIT undone by $4.2B of special items, mostly the EV/BOSK charges. · Open the full presentation →p. 11 — What moved EBIT year over year by segment — volume/mix, pricing, cost, exchange — with the plain-language drivers alongside. · Open the full presentation →p. 12 — Ford Blue: the profit engine. Revenue, wholesale units and EBIT margin by quarter for the gas-and-hybrid business. · Open the full presentation →p. 13 — Ford Model e: revenue shrinking as Mach-E is right-sized and F-150 Lightning discontinued; still deeply loss-making, losses narrowing. · Open the full presentation →p. 14 — Ford Pro: the commercial franchise — high-single-digit-to-low-double-digit margins, lifted by software and physical services. · Open the full presentation →p. 15 — Ford Credit at a glance: earnings before taxes, loss-to-receivables ratio and used-vehicle auction values by quarter. · Open the full presentation →p. 17 — The special items behind the net loss — EV program cancellations and the BOSK joint-venture disposition — laid out line by line. · Open the full presentation →p. 19 — 2026 guidance, revised versus the prior outlook: adjusted EBIT $10–11B and free cash flow $6–7B, with the assumption changes explained. · Open the full presentation →
The fixed-income deck's distinctive content: a deep look at Ford Credit — the captive finance arm the earnings decks only summarize. · Open the full document →
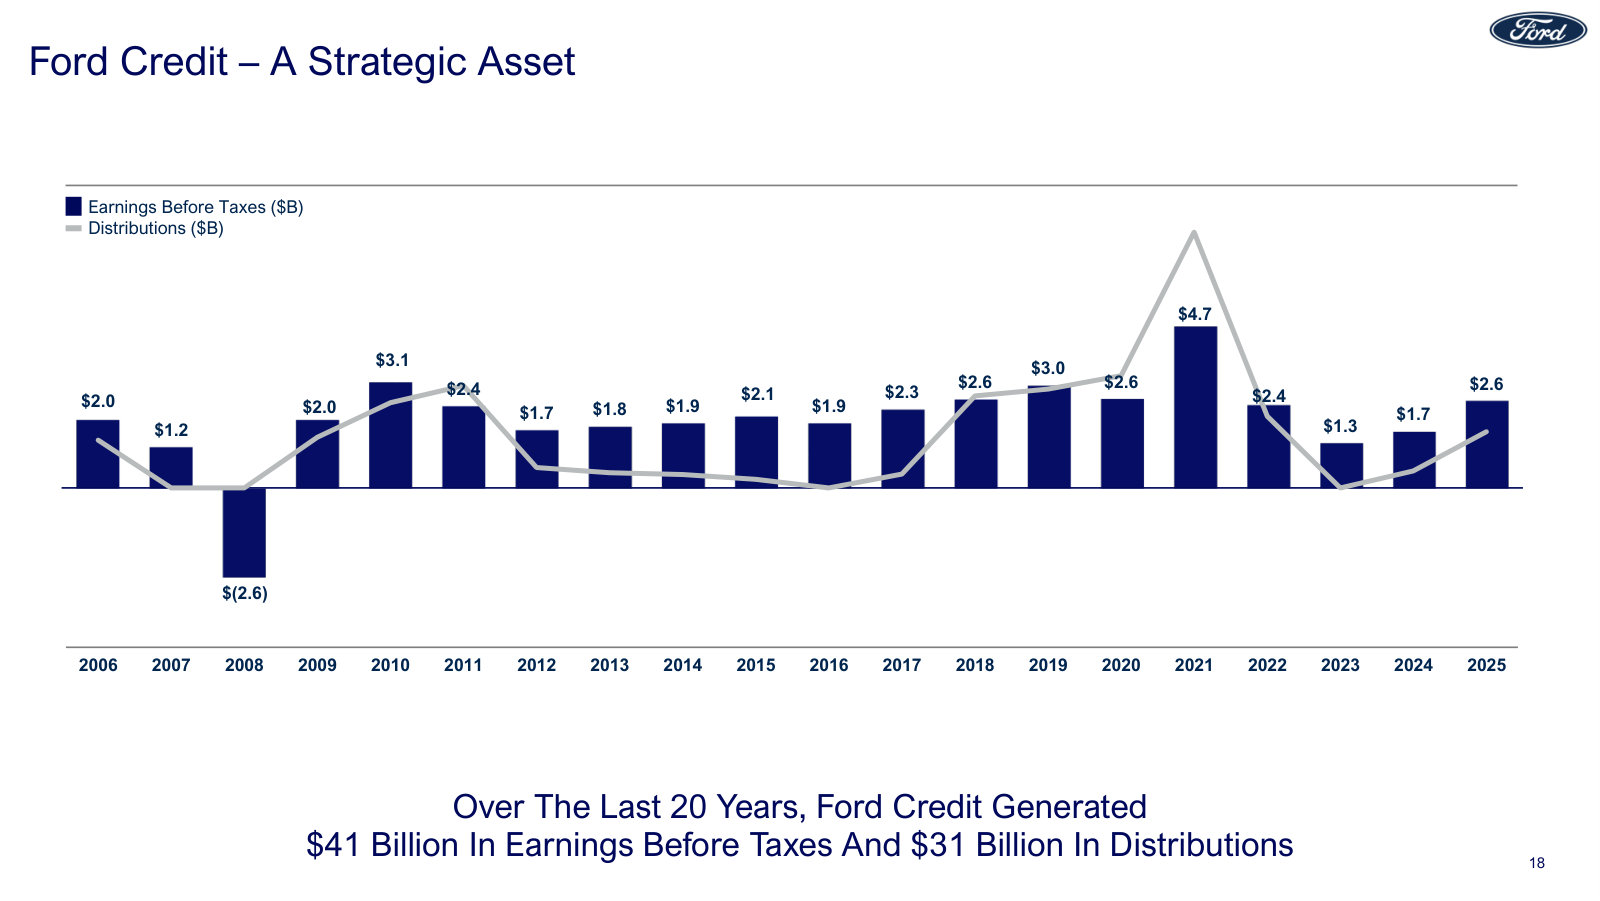
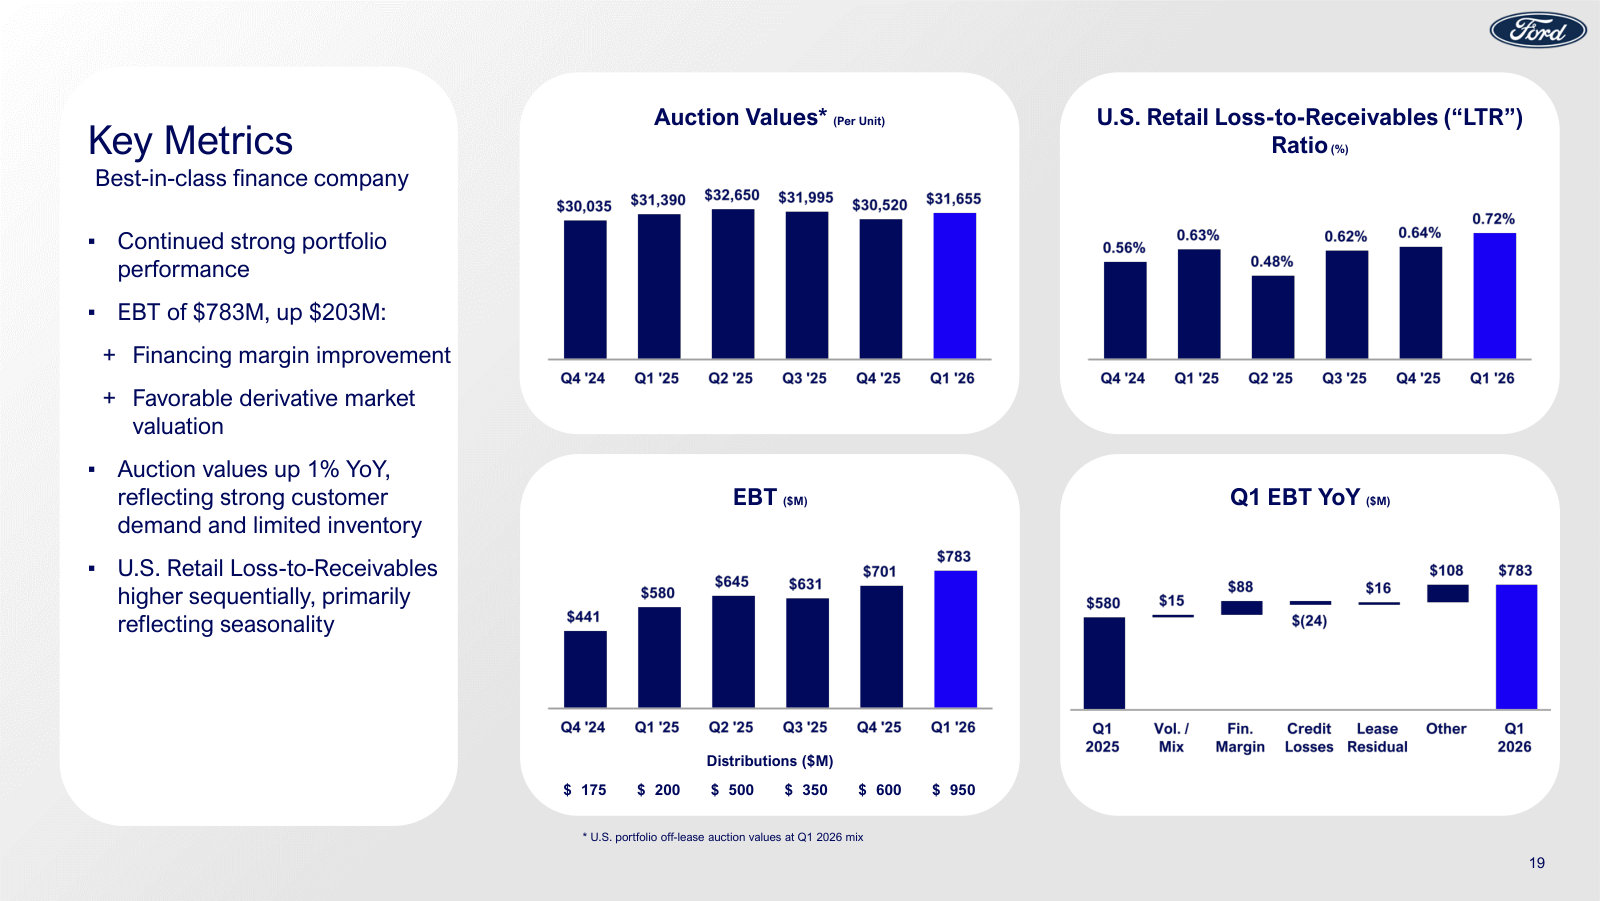
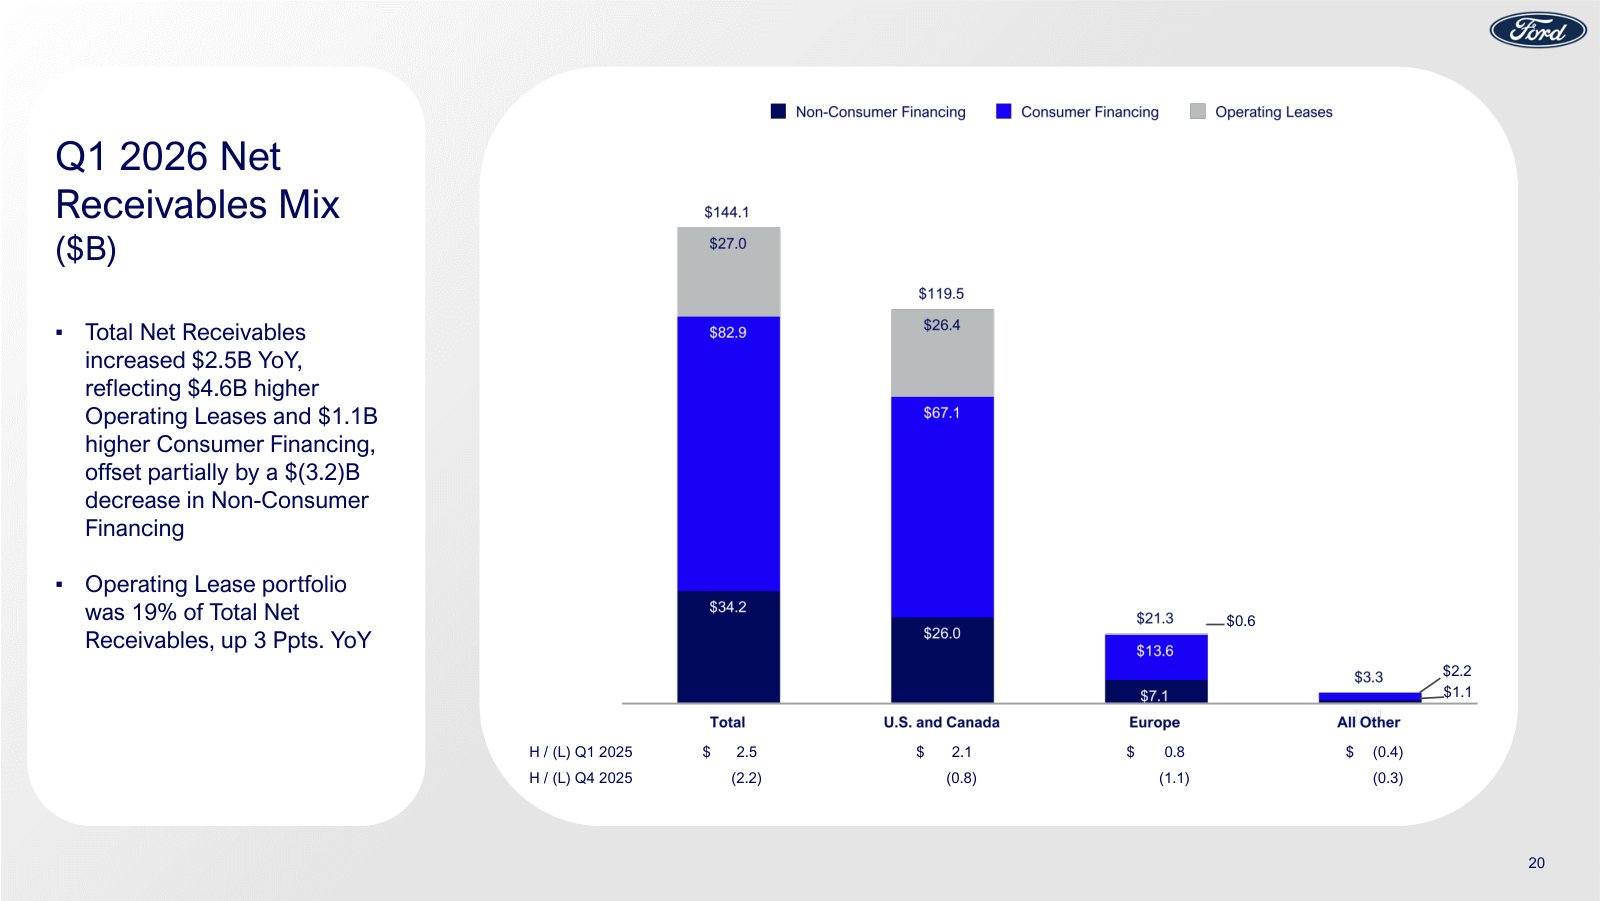
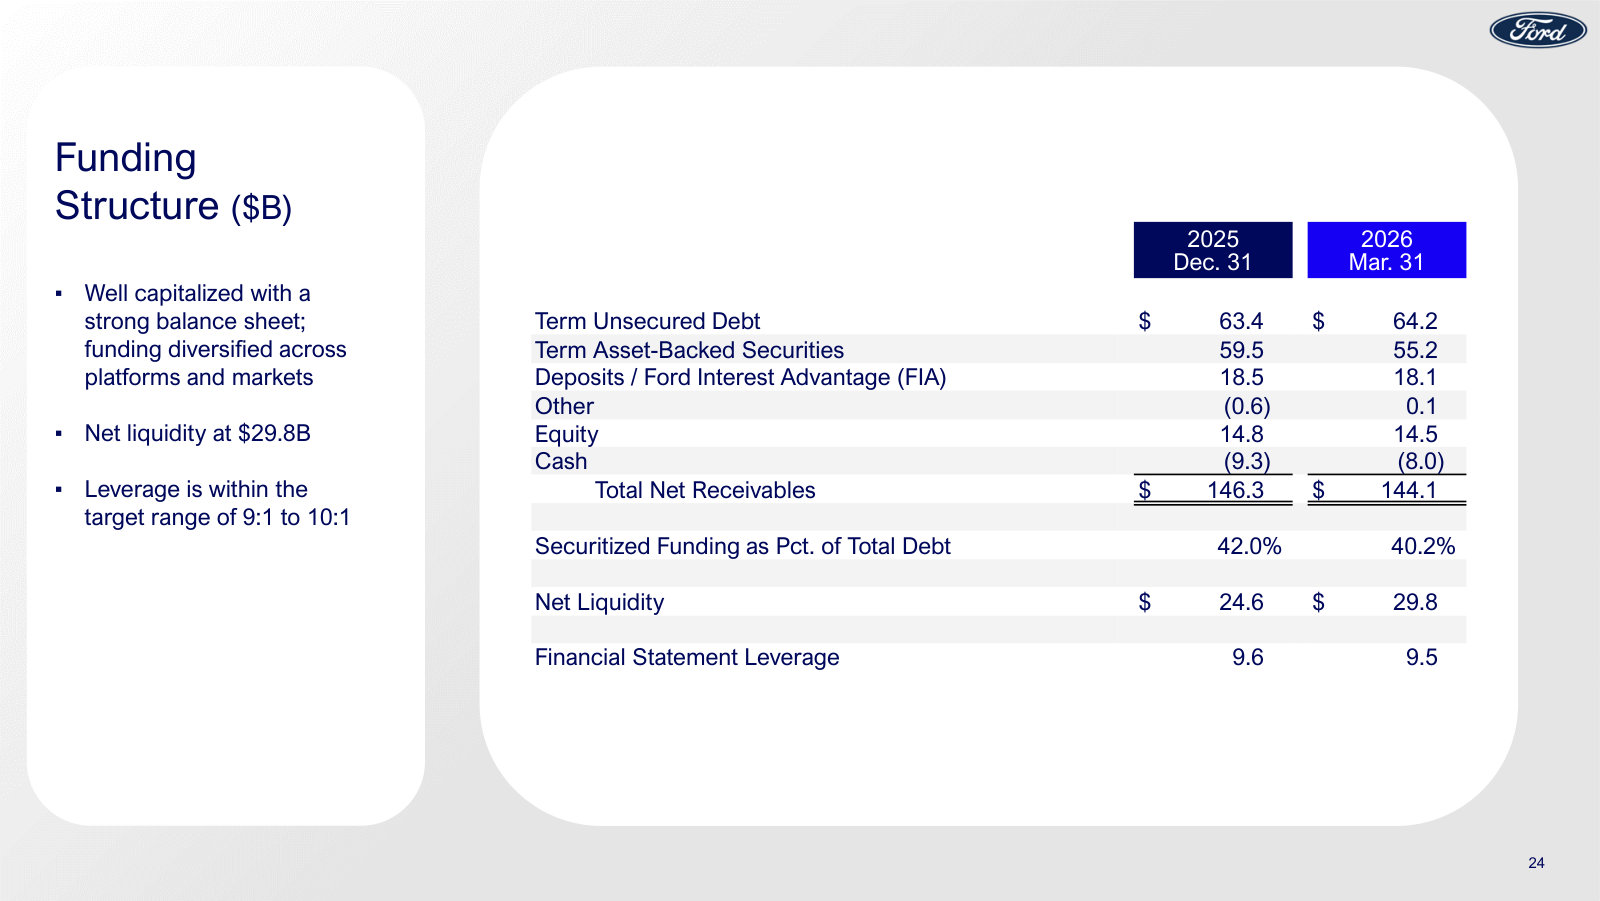
p. 18 — Why Ford Credit is called a strategic asset: 20 years of earnings — $41B before taxes and $31B paid up to the parent. · Open the full presentation →p. 19 — The finance company's core metrics — auction values, loss-to-receivables, quarterly EBT and distributions — that define credit quality. · Open the full presentation →p. 20 — How the $144B receivables book is built: consumer, non-consumer and operating-lease financing split across regions. · Open the full presentation →p. 24 — Ford Credit's funding structure — unsecured debt, asset-backed securities and deposits — run at a targeted 9-to-1 to 10-to-1 leverage. · Open the full presentation →
The fullest single statement of the Ford+ investment thesis and sustainability framing; note it predates the late-2025 EV strategy reset. · Open the full document →
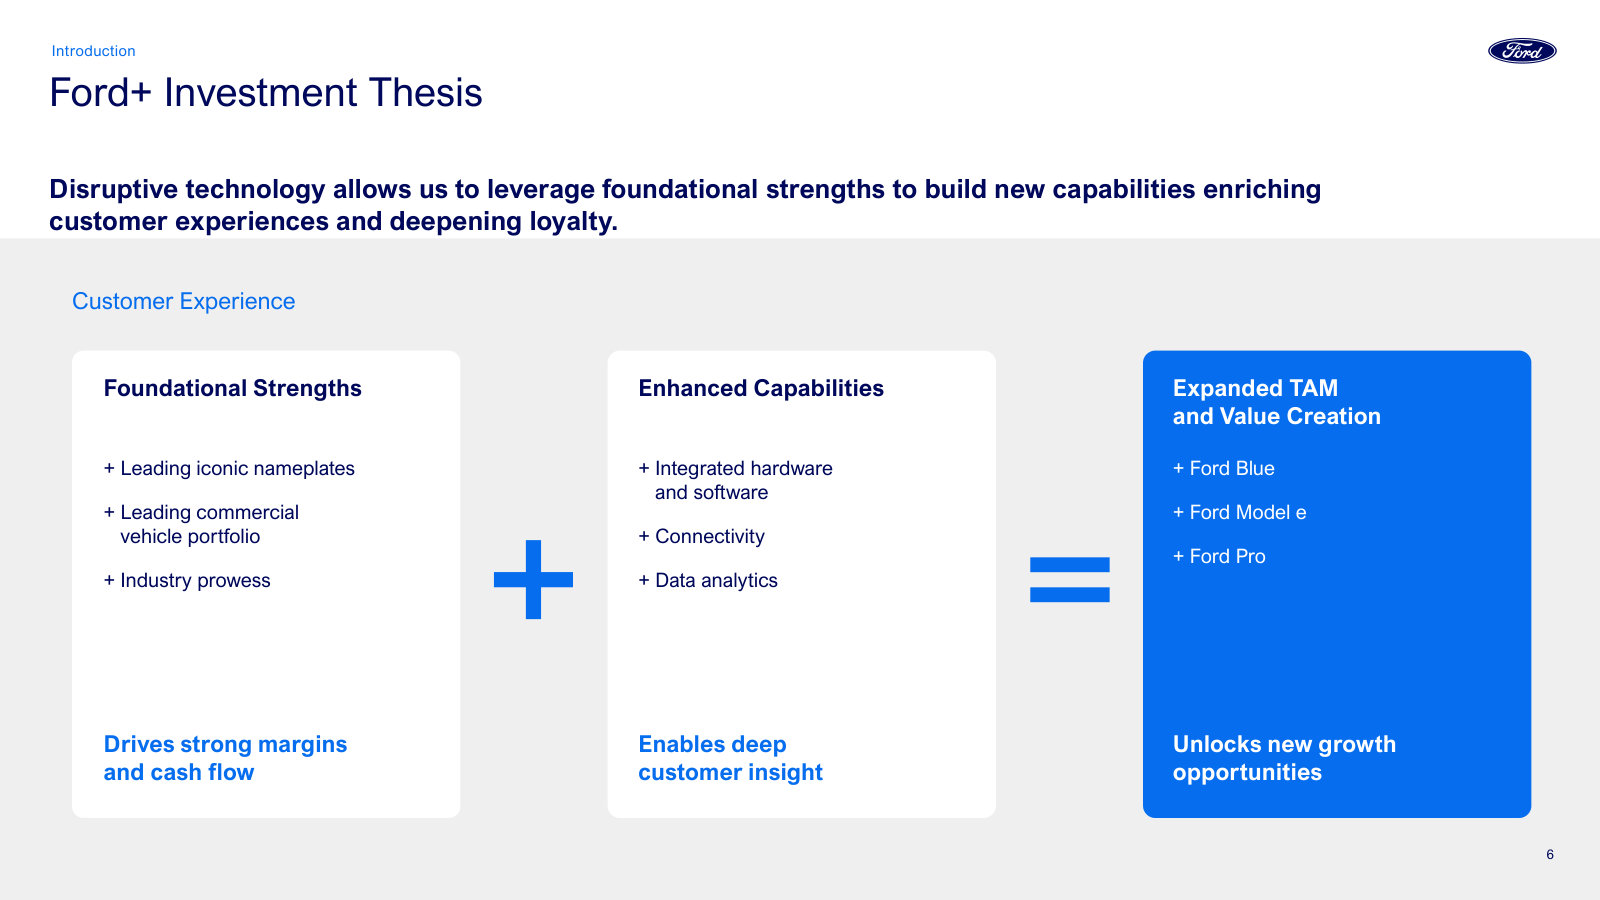
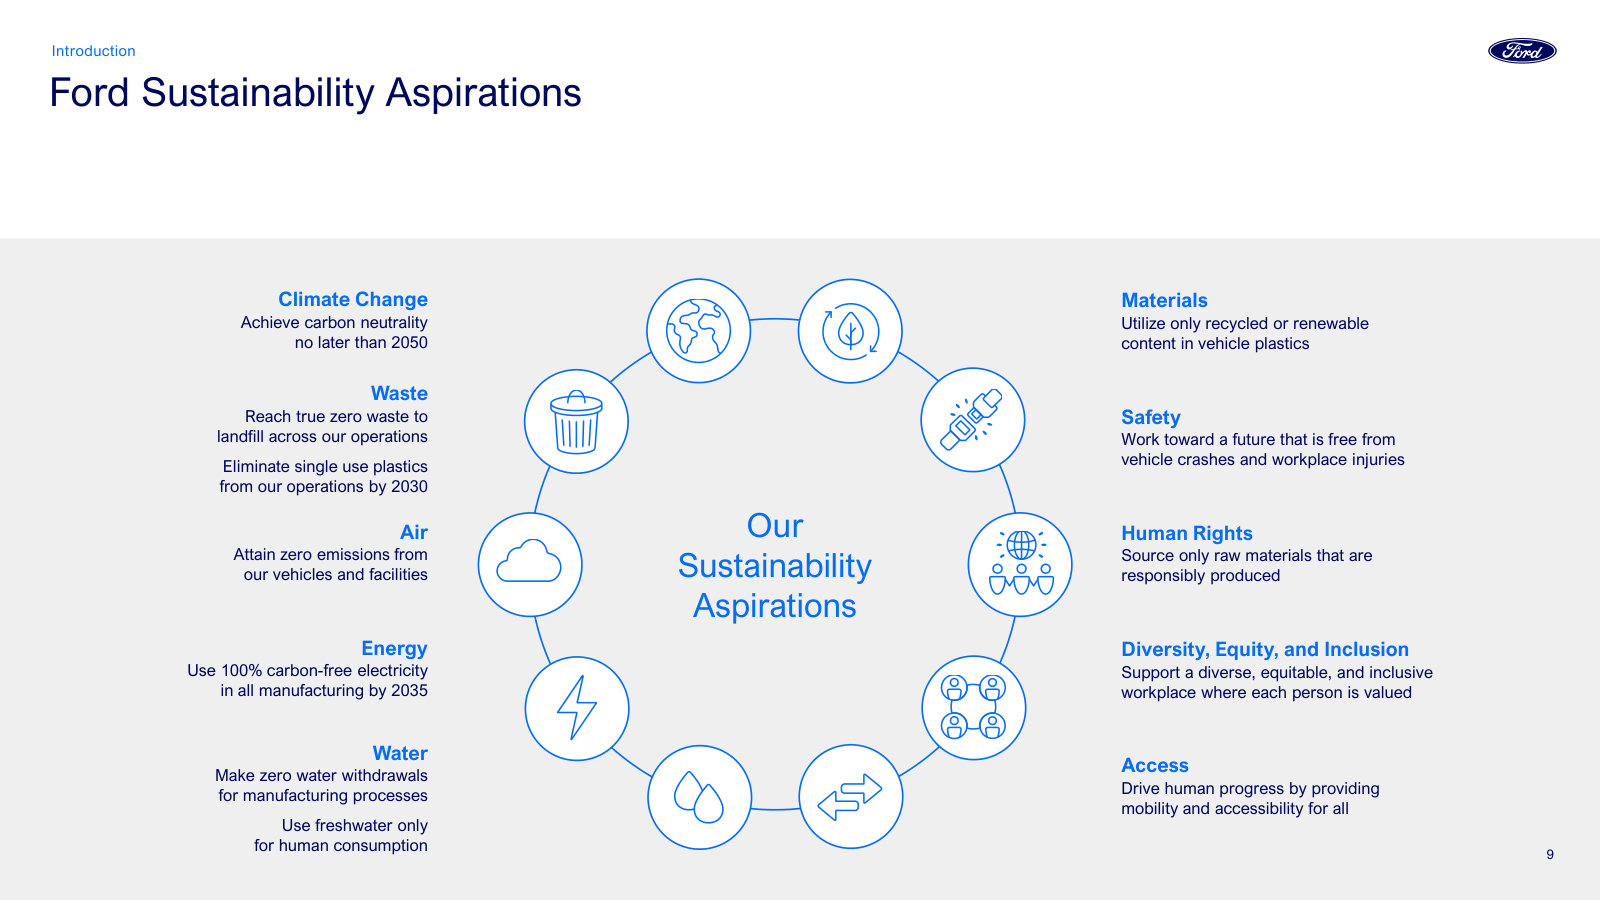
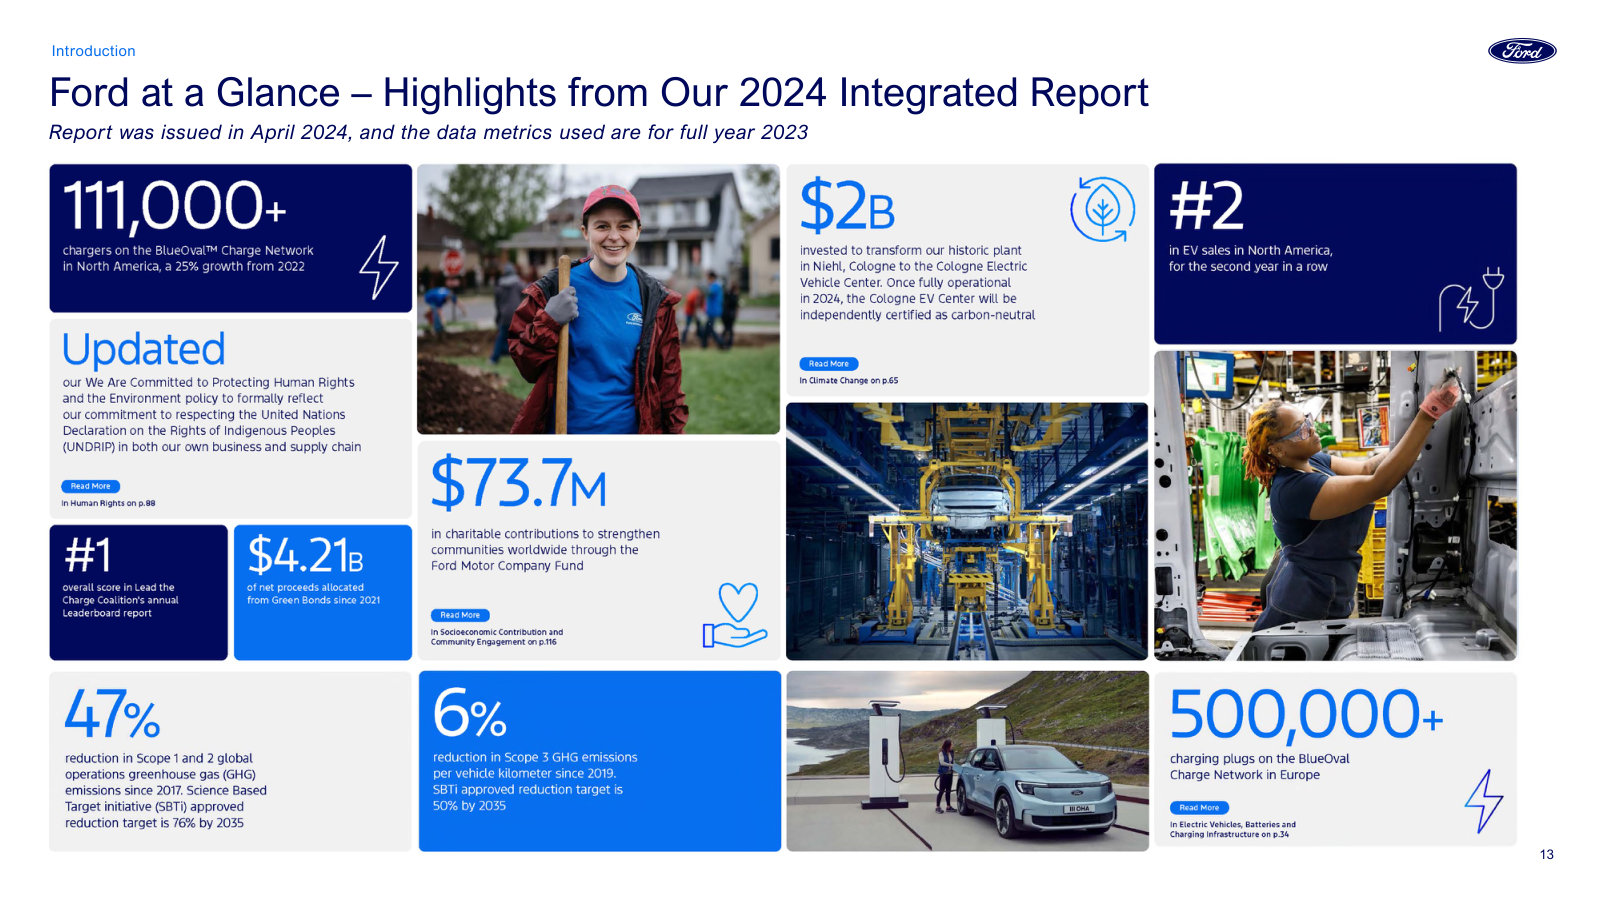
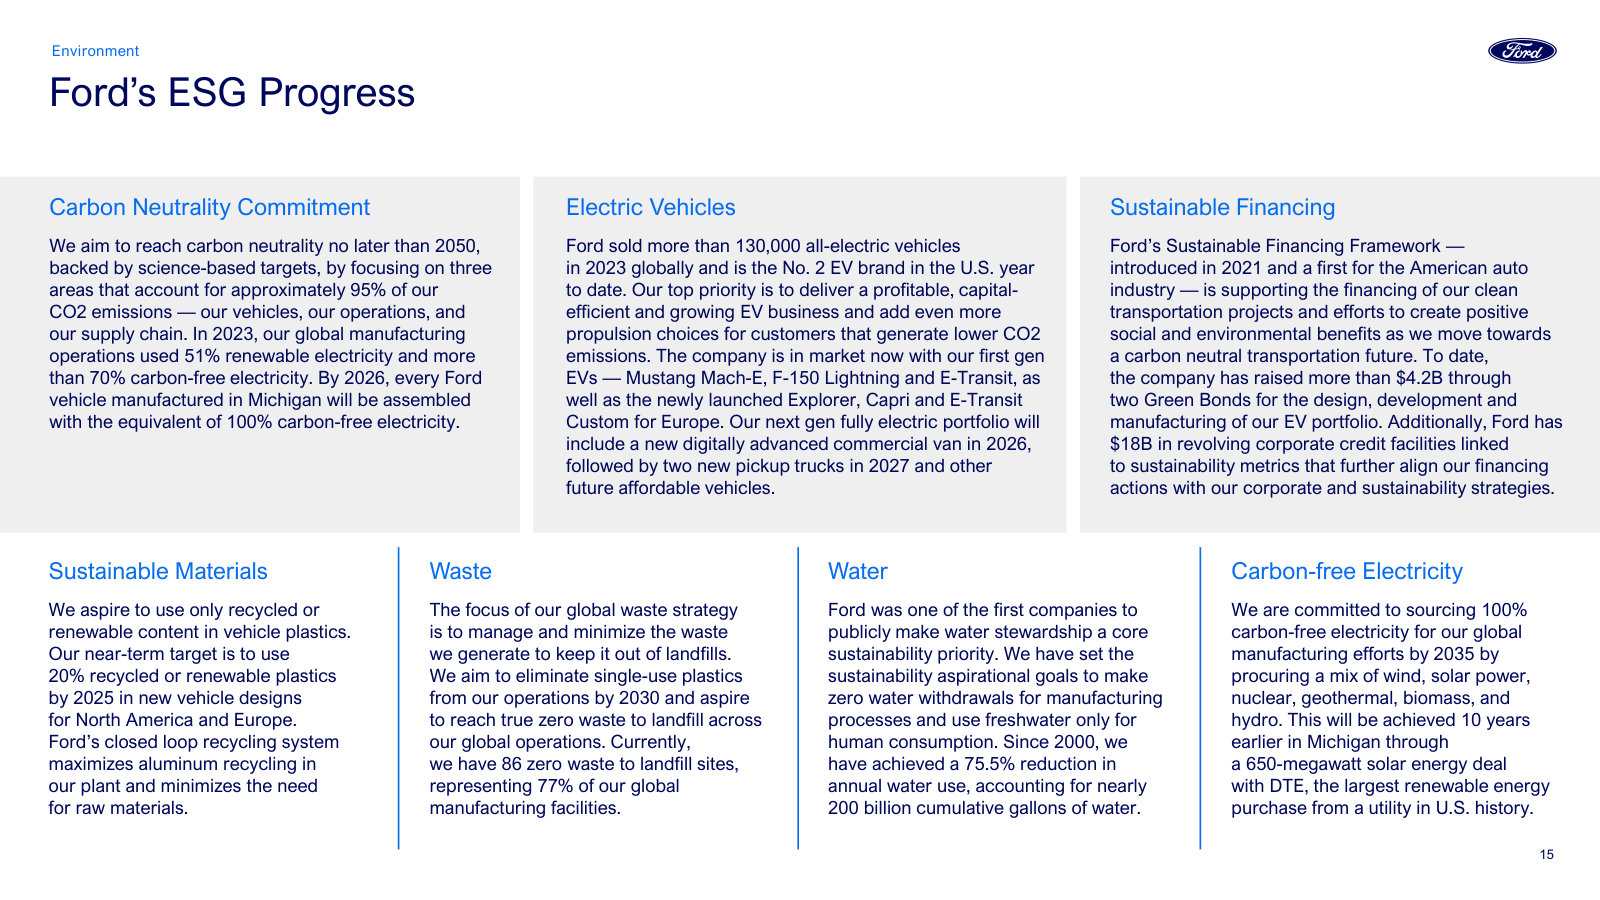
p. 6 — The Ford+ investment thesis in one diagram: foundational strengths plus new capabilities equal an expanded market and value creation. · Open the full presentation →p. 9 — Ford's sustainability aspirations as a wheel — the ten target areas from carbon neutrality to safety and access. · Open the full presentation →p. 13 — Ford at a glance: full-year 2023 operating and ESG statistics on one page, from charging network to emissions reductions. · Open the full presentation →p. 15 — How Ford framed carbon neutrality, its electric-vehicle push and sustainable financing as of 2024 — since overtaken on EV specifics. · Open the full presentation →
Societe Generale Mobility Credit Conference — 2026 · 51 pages · Ford+ strategy, full-year 2025 results and the Ford Credit deep-dive bundled into one conference deck. · Open →
Q4 & Full Year 2025 Earnings Presentation — Q4 & FY 2025 · 37 pages · Full-year 2025 segment results, the initial 2026 guidance, and the $10.7B Model e impairment behind the EV reset. · Open →
Q3 2025 Fixed Income Investor Presentation — Q3 2025 · 45 pages · The Ford Credit and funding detail as of Q3 2025, before this year's EV writedowns. · Open →
Q1 2025 Fixed Income Presentation (Lloyds Bank Investor Forum) — Q1 2025 · 42 pages · An earlier fixed-income investor deck for a debt-focused audience. · Open →
Q4 & Full Year 2024 Earnings Presentation — Q4 & FY 2024 · 39 pages · The FY2024 results and original 2025 guidance — the prior-year baseline these decks are measured against. · Open →