Annual Reports
Ford Motor Company's annual reports contain management's most considered account of the business. These are the sections, passages and visual pages worth opening in the originals preserved in Sources.
Ford Motor Company — FY2025 Annual Report (Form 10-K) — FY2025
The year Ford took an $8.2B GAAP loss on a $10.7B EV writedown while adjusted EBIT stayed positive — management's own account of the reset. · Open the full document →
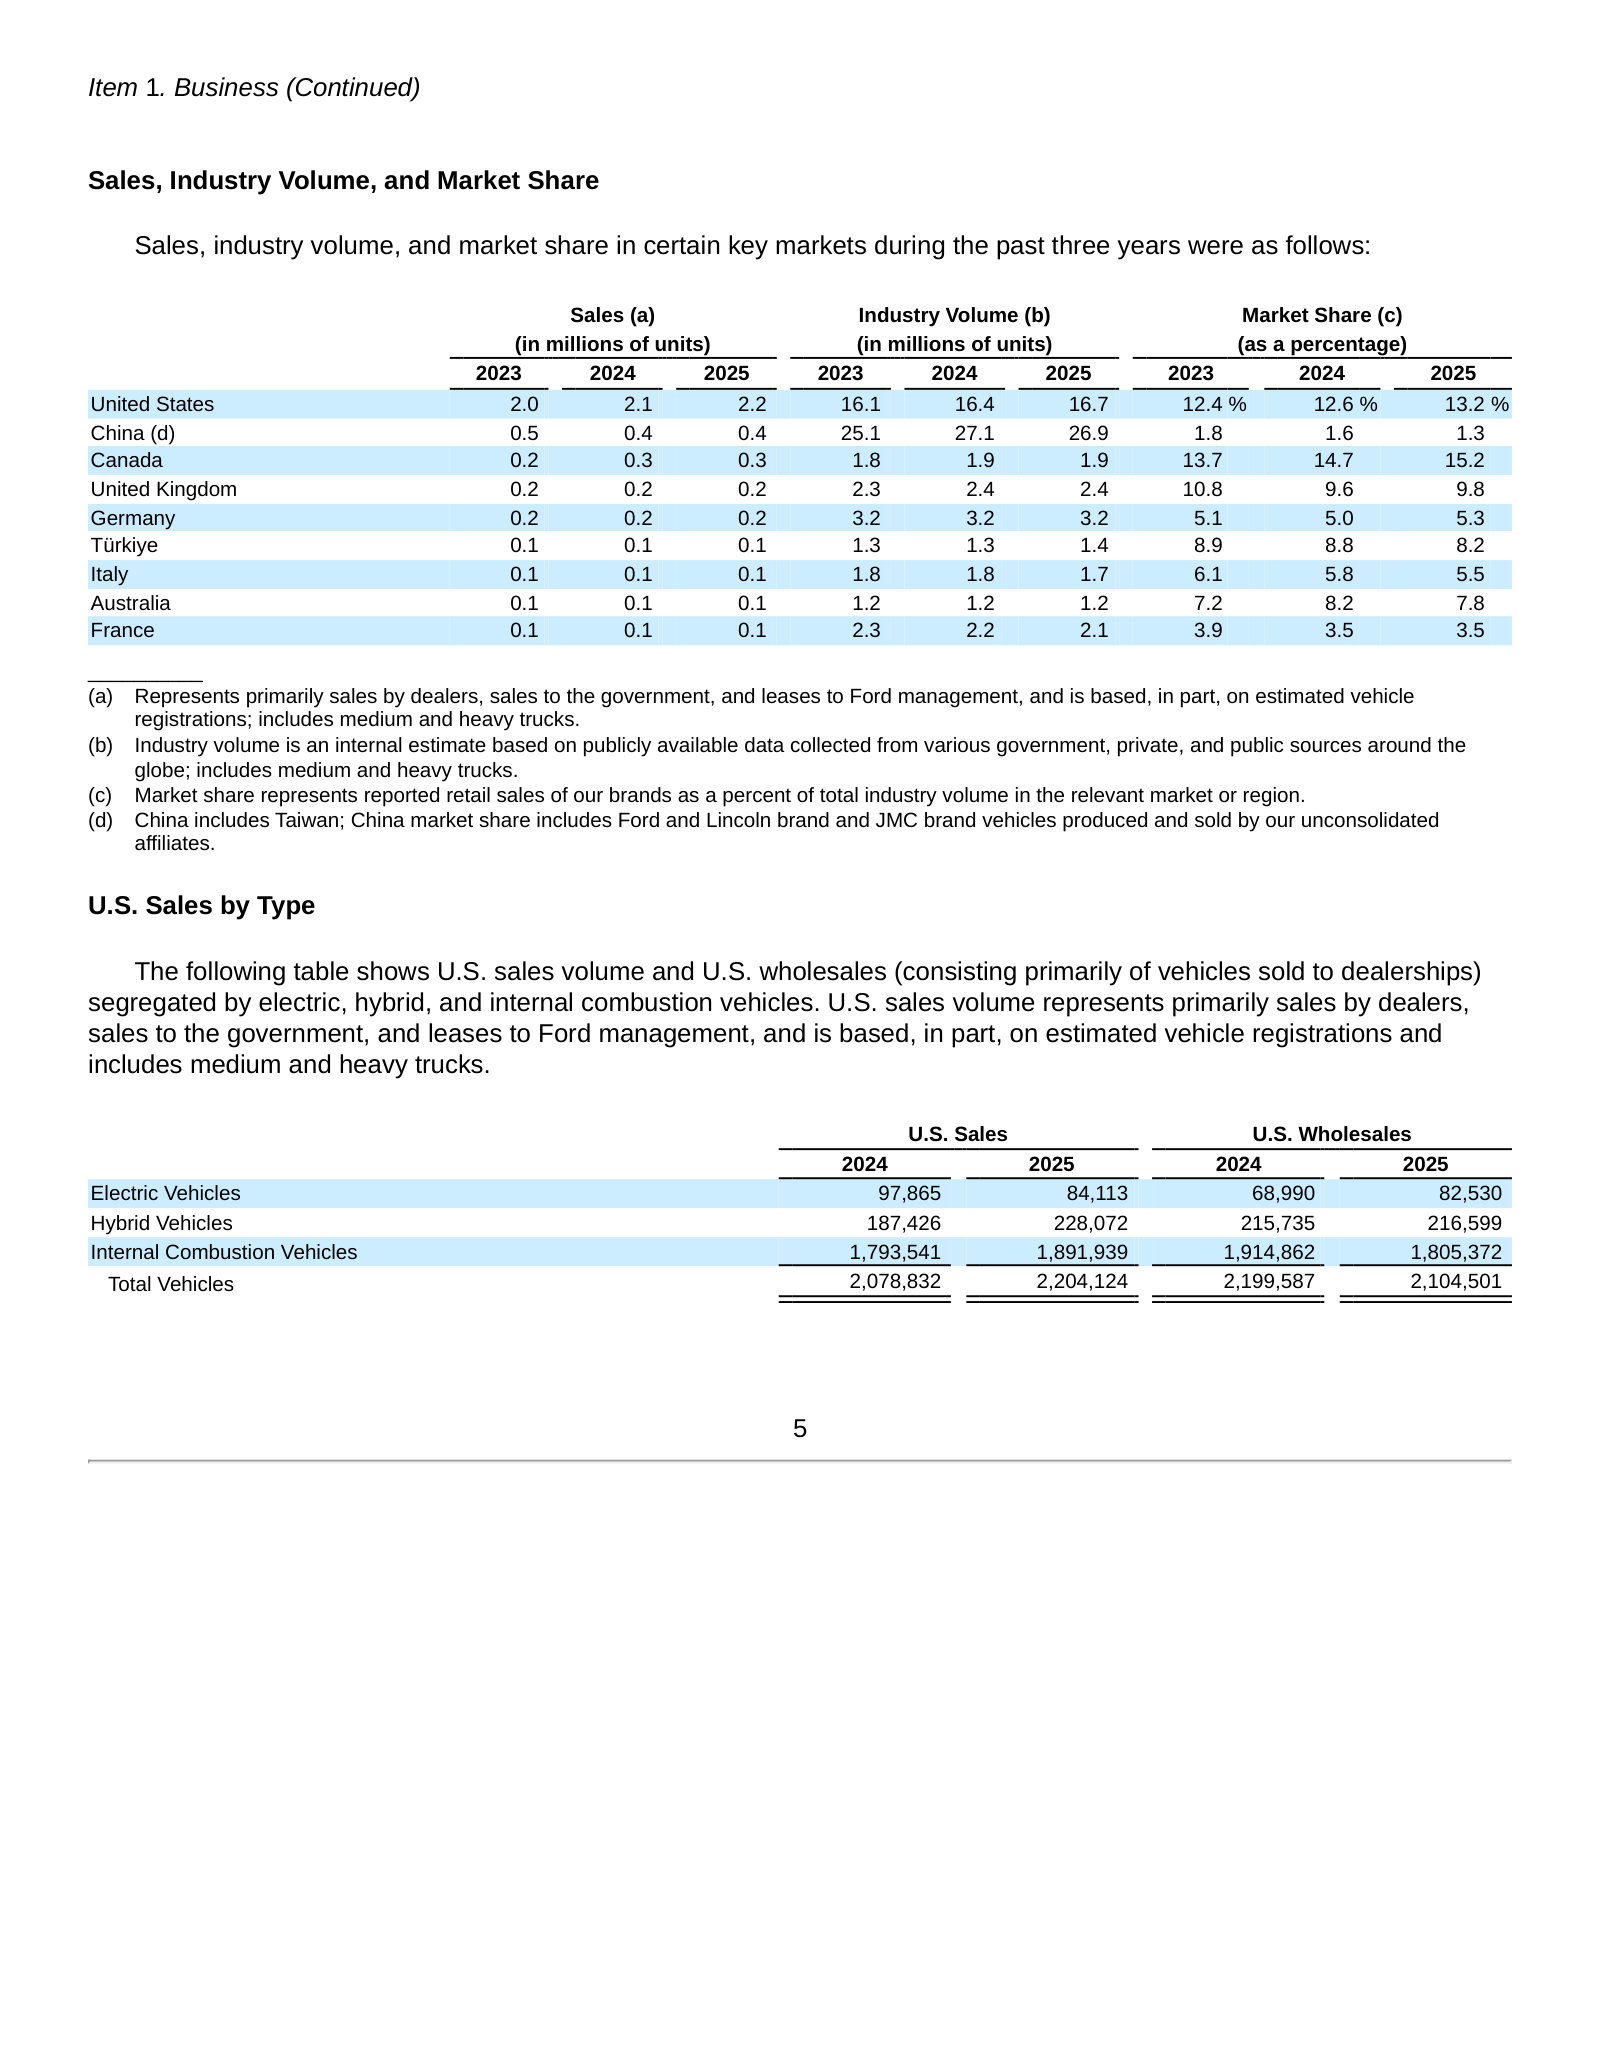
Item 1. Business — p. 5 · Read the full section →
Defines how Ford now organizes itself: ICE/hybrid (Ford Blue), EVs (Model e), commercial (Ford Pro), plus the Ford Credit finance arm.
Item 1A. Risk Factors — p. 30 · Read the full section →
The two risks most specific to Ford: profit concentration in large ICE trucks and SUVs, and EV demand running below plan.
Profit depends on selling large, profitable trucks and utilities in the U.S.
Ford’s results are dependent on sales of larger, more profitable vehicles, particularly in the United States. A shift in consumer preferences away from larger, more profitable vehicles with internal combustion engines (including trucks and utilities) to other vehicles in our portfolio that may be less profitable could result in an adverse effect on our financia condition or results of operations.
p. 50 · Read in context →
EV adoption has run below plan, forcing Ford to keep adjusting investment and production.
Although we are investing in our EV strategy, we anticipate that the EV market will continue to evolve. To date, we have observed lower-than-anticipated industrywide EV adoption rates due to changes in consumer sentiment, competitive dynamics, legal and policy changes, and significant developments in vehicle pricing dynamics, among other factors that we continue to monitor. This environment has led us, and may in the future lead us, to adjust our investments, spending, production, and product and future technology launches to better match the pace of EV adoption.
p. 48 · Read in context →
Item 7. MD&A — Key Trends and Economic Factors Affecting Ford and the Automotive Industry — p. 74 · Read the full section →
Management leads the MD&A with trade policy — the tariff regime is now the first-order variable for an automaker with global supply chains.
Tariffs framed as a material, ongoing disruption to the industry and to Ford.
Tariffs implemented to date in the United States and elsewhere have caused significant disruption, increased costs (both directly and indirectly), and uncertainty in the automotive industry, including for Ford, other OEMs, suppliers, and dealers, as well as customers.
p. 74 · Read in context →
Item 7. MD&A — Results of Operations – 2025 — p. 81 · Read the full section →
The story of the year: adjusted EBIT stayed positive, but special-item charges led by the Model e writedown drove a GAAP net loss.
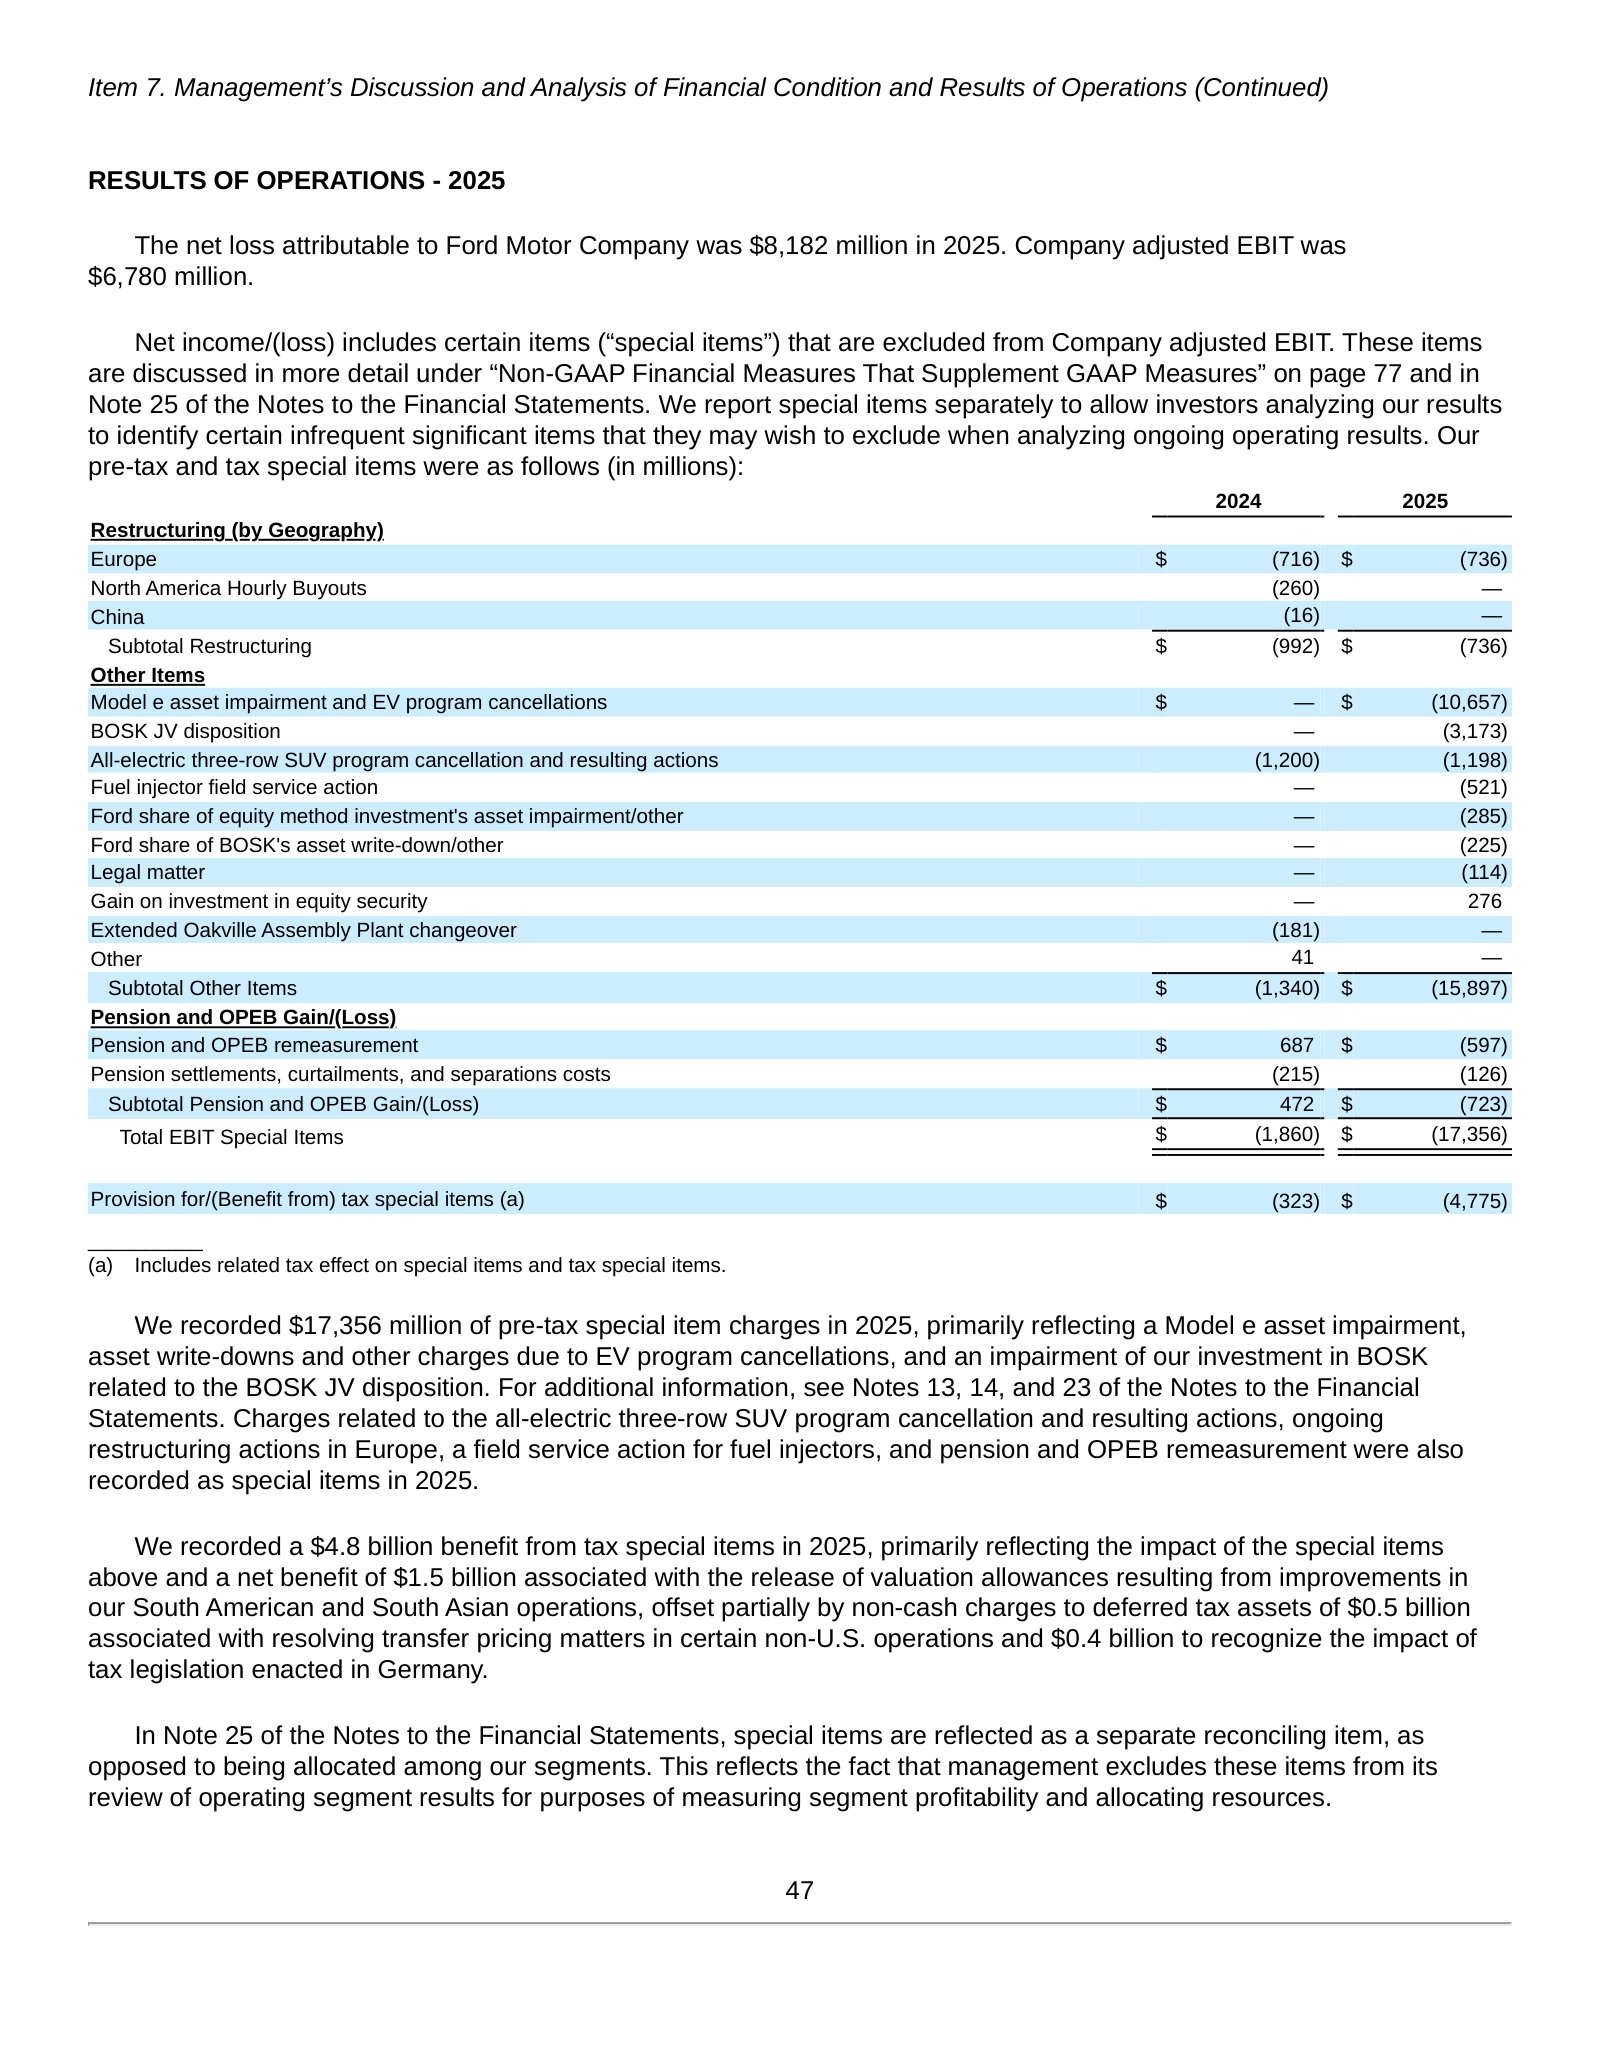
The GAAP-vs-adjusted gap: negative net margin, still-positive adjusted EBIT margin.
Net income/(loss) margin was negative 4.4% in 2025, down from 3.2% a year ago. Company adjusted EBIT margin was 3.6% in 2025, down from 5.5% a year ago.
p. 82 · Read in context →
Item 7. MD&A — Outlook — p. 112 · Read the full section →
The forward guidance and, just as important, the tariff and policy assumptions management explicitly excludes from it.
2026 guidance rests on stated assumptions and excludes unannounced tariff or policy changes.
We provided 2026 Company guidance in our earnings release furnished on Form 8-K dated February 10, 2026. The guidance is based on our expectations as of February 10, 2026, and assumes no material change to our current assumptions for inflation, logistics issues, production, or macroeconomic conditions. Moreover, our guidance has not factored in any new policy changes by the administration in the United States, including future or revised tariffs or related offsets, that have not been announced or tariffs or other policy changes that may be announced by other governments after the date hereof.
p. 112 · Read in context →
Critical Accounting Estimates — Warranties and Field Service Actions — p. 124 · Read the full section →
The accrual that translates recalls and field service actions into earnings — a defining, judgment-heavy cost line for a legacy automaker.
Warranty and recall costs are accrued at the time of sale, then re-estimated over time.
Separately, we also periodically perform field service actions related to safety recalls, emission recalls, and other product campaigns. Software updates are increasingly a component of vehicle service and may be performed during warranty coverage repairs, through field service actions, or through over-the-air updates. We accrue the estimated cost of both base warranty coverages and field service actions at the time of sale.
p. 124 · Read in context →
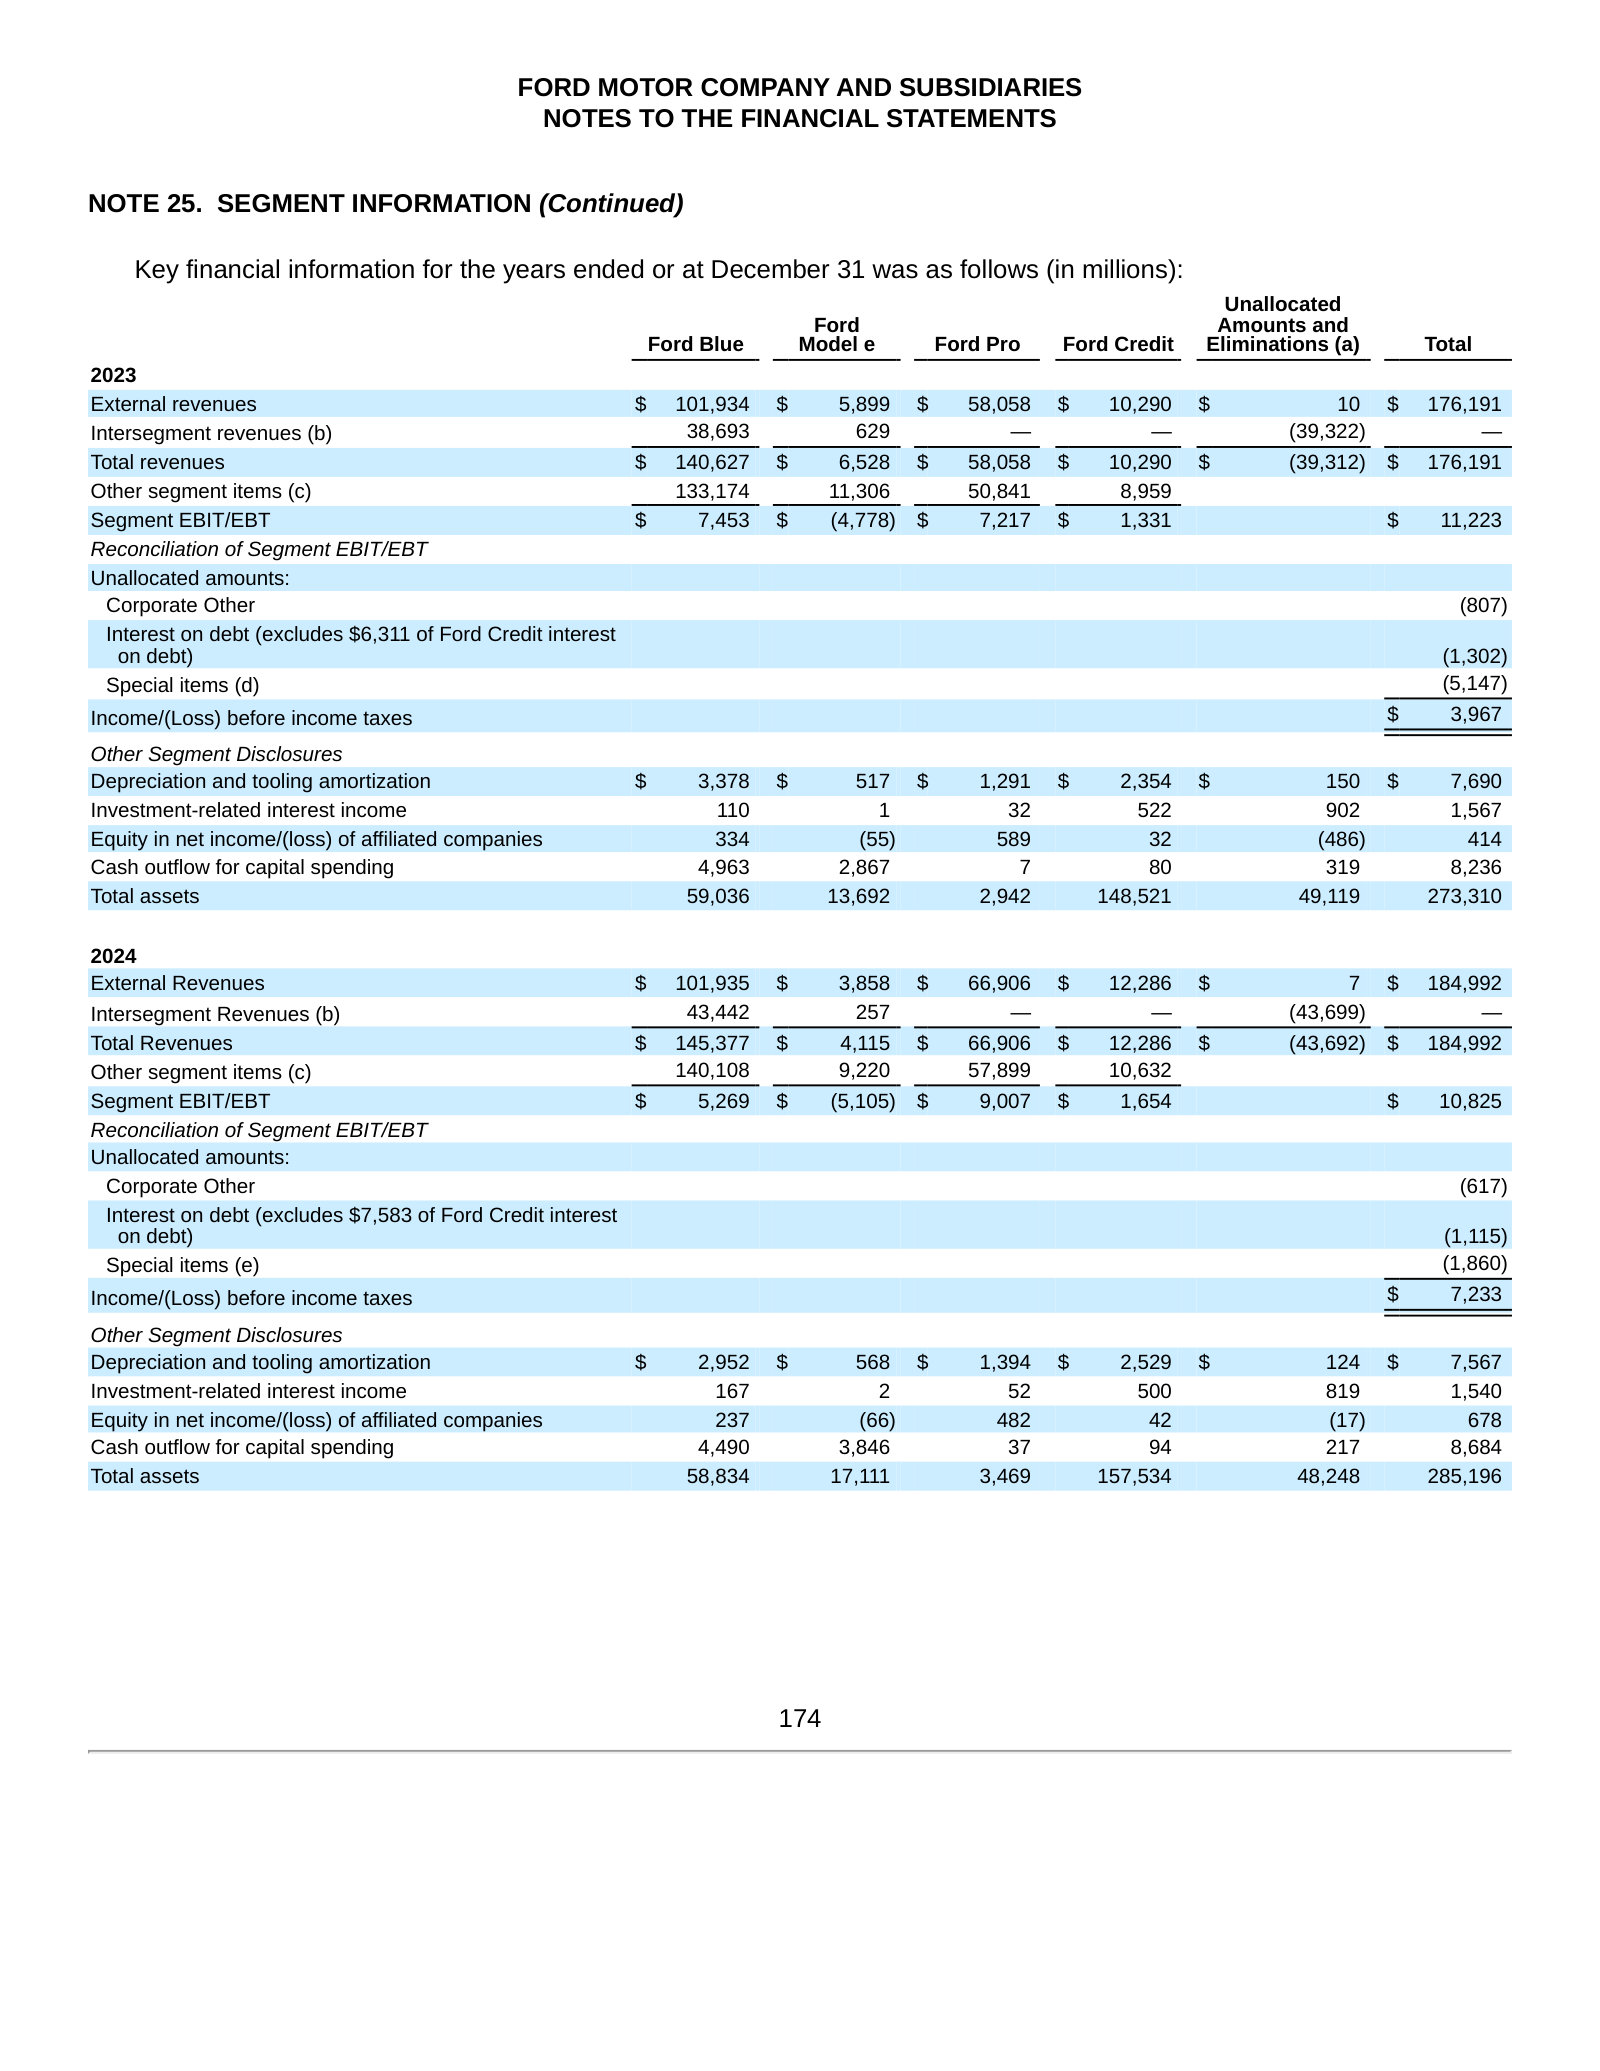
Note 25. Segment Information — p. 235 · Read the full section →
The audited segment financials behind the story — revenue and results split across Ford Blue, Model e, Ford Pro, and Ford Credit.
Ford Motor Company — FY2021 Annual Report (Form 10-K) — FY2021
Included for one contrast: the pre-Ford+ structure, before Ford split its car business into Ford Blue, Model e, and Ford Pro. · Open the full document →
Item 1. Business — Overview (pre-reorganization segments) — p. 5 · Read the full section →
In FY2021 the whole car business was one Automotive segment reported by region — the structure the FY2022 redefinition replaced.
One Automotive segment, organized by geography — later split into Ford Blue, Model e, and Ford Pro.
The Automotive segment primarily includes the sale of Ford and Lincoln vehicles, service parts, and accessories worldwide, together with the associated costs to develop, manufacture, distribute, and service the vehicles, parts, and accessories. This segment includes revenues and costs related to our electrification vehicle programs. The segment includes the following regional business units: North America, South America, Europe, China (including Taiwan), and the International Markets Group.
p. 6 · Read in context →
More annual reports
Ford Motor Company — FY2024 Annual Report (Form 10-K) — FY2024 · 233 pages · The last full year of net income ($5.9B) before the 2025 reset — the base case the FY2025 charges are measured against. · Open →
Ford Motor Company — FY2023 Annual Report (Form 10-K) — FY2023 · 232 pages · Second full year of the three-segment reporting, with Ford Pro emerging as the profit engine and Model e losses widening. · Open →
Ford Motor Company — FY2022 Annual Report (Form 10-K) — FY2022 · 228 pages · First 10-K under the Ford Blue / Ford Model e / Ford Pro structure — the segment redefinition in its debut year. · Open →