Full Report
The numbers behind Ford Motor Company: as-reported financial statements and company metrics for FY2021–FY2025, traced to the source filings, opened with the share-price history those statements have to justify. Every linked figure opens the exact page of the filing it was printed on, with the statement row highlighted. Amounts in US$ millions unless noted.
Reading notes: years FY2021-FY2022 income-statement and cash-flow figures are the comparative columns of the FY2023 Form 10-K (p.146 / p.145); FY2023-FY2025 are from the FY2025 Form 10-K (p.160 / p.162). Balance-sheet FY2021 is the comparative column of the FY2022 Form 10-K (p.149); FY2022-FY2023 from the FY2023 Form 10-K (p.147); FY2024-FY2025 from the FY2025 Form 10-K (p.161). Ford reports two revenue lines on the income statement — Company excluding Ford Credit and Ford Credit. The revenue_breakdown statement instead uses Note 25 external segment revenues (Ford Blue, Ford Model e, Ford Pro, Ford Credit); these four do not sum exactly to Total revenues because a small unallocated/Ford Next/Corporate Other remainder (US$10-144M) is omitted, so no sum-check is asserted on the total. Segment EBIT/EBT (segment_profit) is shown only for FY2023-FY2025. Ford adopted the Ford Blue / Model e / Pro segment structure reporting Segment EBIT/EBT from FY2023; FY2021-FY2022 were reported on a segment 'Income/(Loss) before income taxes' basis (a different metric) and are left blank rather than mixing bases.
Share Price — Full Available History — 37 Years
The stock closed at $14.68 on Jul 31, 2026 — up 867% over the window shown (+6.4% a year), trading between $0.80 and $30.71.
Source: market price feed, monthly closes, sampled from 9,213 source observations, Jan 1990–Jul 2026. Price return only, excludes dividends. Prices are split-adjusted (1:2 on Jul 06, 1994; ×1.5058 on Apr 08, 1998; ×1.04091 on Jun 29, 2000; ×1.74818 on Aug 03, 2000).
Market capitalization $59.0bn.
Market cap = 4.02B shares outstanding × the Jul 31, 2026 close of $14.68. Market-derived, shown without filing links.
FY2025 at a Glance
Revenue (US$ millions)
Operating income (US$ millions)
Net income (US$ millions)
Diluted EPS
Source: FY2025 consolidated statements [1] [2]. Click any linked figure to open the filing page with the row highlighted.
Revenue by Operating Segment (External)
| Revenue by Operating Segment (External) | FY2021 | FY2022 | FY2023 | FY2024 | FY2025 |
|---|---|---|---|---|---|
| Ford Blue | 80,377 | 94,762 | 101,934 | 101,935 | 101,019 |
| Ford Model e | 3,098 | 5,253 | 5,899 | 3,858 | 6,670 |
| Ford Pro | 42,649 | 48,939 | 58,058 | 66,906 | 66,286 |
| Ford Credit | 10,073 | 8,978 | 10,290 | 12,286 | 13,271 |
| Total revenues | 136,341 | 158,057 | 176,191 | 184,992 | 187,267 |
| Total revenues growth, derived | — | +15.9% | +11.5% | +5.0% | +1.2% |
Source: Note 25 Segment Information — external revenues by segment; total ties to Consolidated Income Statements [3] [4] [1] [5]. Click any linked figure to open the filing page with the row highlighted.
Segment EBIT / EBT
| Segment EBIT / EBT | FY2021 | FY2022 | FY2023 | FY2024 | FY2025 |
|---|---|---|---|---|---|
| Ford Blue | — | — | 7,453 | 5,269 | 3,024 |
| Ford Model e | — | — | (4,778) | (5,105) | (4,806) |
| Ford Pro | — | — | 7,217 | 9,007 | 6,843 |
| Ford Credit | — | — | 1,331 | 1,654 | 2,557 |
Source: Note 25 Segment Information — Segment EBIT/EBT (new Ford Blue / Model e / Pro / Credit basis, reported from FY2023) [3] [4]. Click any linked figure to open the filing page with the row highlighted.
Income Statement
Source: Consolidated Income Statements [1] [2]. Click any linked figure to open the filing page with the row highlighted.
Columns marked E are consensus analyst estimates from S&P Capital IQ (CapIQ), shown alongside reported results for direct comparison; they are not company guidance.
Estimate source: S&P Capital IQ (CapIQ) consensus, as of 2026-08-01. Estimate figures are S&P Capital IQ consensus (vendor data — no filing page links). EPS and net income use the normalized (adjusted) consensus where the street reports it. Line-item analyst models (segments, drivers, KPIs) are in the Visible Alpha tab.
Balance Sheet
Source: Consolidated Balance Sheets [6] [7] [8]. Click any linked figure to open the filing page with the row highlighted.
Cash Flow
Source: Consolidated Statements of Cash Flows [9] [10]. Click any linked figure to open the filing page with the row highlighted.
Wholesale Unit Volumes by Segment
| Wholesale Unit Volumes by Segment | FY2021 | FY2022 | FY2023 | FY2024 | FY2025 |
|---|---|---|---|---|---|
| Ford Blue (000 units) | — | — | 2,920 | 2,862 | 2,728 |
| Ford Model e (000 units) | — | — | 116 | 105 | 178 |
| Ford Pro (000 units) | — | — | 1,377 | 1,503 | 1,488 |
| Total Company wholesales (000 units) | — | — | 4,413 | 4,470 | 4,395 |
Source: company filings [11] [12] [13] [14]. Click any linked figure to open the filing page with the row highlighted.
Warranty Field Service Actions
| Warranty Field Service Actions | FY2021 | FY2022 | FY2023 | FY2024 | FY2025 |
|---|---|---|---|---|---|
| Warranty accrual (year-end balance) | — | 9,193 | 11,504 | 14,032 | 17,190 |
| Warranty payments made during period | — | 4,166 | 4,779 | 5,831 | 5,733 |
| Adverse development on pre-existing warranties | — | 1,134 | 2,648 | 2,690 | 2,266 |
Source: company filings [15] [16]. Click any linked figure to open the filing page with the row highlighted.
Ford Credit Performance
| Ford Credit Performance | FY2021 | FY2022 | FY2023 | FY2024 | FY2025 |
|---|---|---|---|---|---|
| Total net receivables (managed) | — | — | 133,200 | 143,600 | 146,300 |
| Loss-to-receivables ratio (bps) | — | — | 35 | 50 | 59 |
| Return on equity | — | — | 10.6% | 9.1% | 14.9% |
| Distributions to parent (Company excl. Ford Credit) | — | — | — | 500 | 1,650 |
Source: company filings [17] [18] [19]. Click any linked figure to open the filing page with the row highlighted.
Investment, Workforce Shareholder Returns
| Investment, Workforce Shareholder Returns | FY2021 | FY2022 | FY2023 | FY2024 | FY2025 |
|---|---|---|---|---|---|
| Engineering, research development | 7,600 | 7,800 | 8,200 | 8,000 | 9,400 |
| Advertising expense | 3,100 | 2,200 | 2,500 | 2,800 | 2,700 |
| Employees worldwide (year-end) | 183,000 | 173,000 | 177,000 | 171,000 | 169,000 |
| Dividends declared per share | — | 0.50 | 1.25 | 0.78 | 0.75 |
Source: company filings [20] [21] [22] [23]. Click any linked figure to open the filing page with the row highlighted.
Long-Term Record
| Fiscal year | Total revenue | Operating income/(loss) | Net income/(loss) attributable to Ford | Diluted EPS | Operating cash flow |
|---|---|---|---|---|---|
| FY2016 | 151,800 | — | — | 1.15 | — |
| FY2017 | 156,776 | 4,881 | — | 1.93 | 18,096 |
| FY2018 | 160,338 | 3,203 | — | 0.92 | 15,022 |
| FY2019 | 155,900 | 574 | — | 0.01 | 17,639 |
| FY2020 | 127,144 | (4,408) | — | (0.32) | 24,269 |
| FY2021 | 136,341 | 4,523 | 17,937 | 4.45 | 15,787 |
| FY2022 | 158,057 | 6,276 | (1,981) | (0.49) | 6,853 |
| FY2023 | 176,191 | 5,458 | 4,347 | 1.08 | 14,918 |
| FY2024 | 184,992 | 5,219 | 5,879 | 1.46 | 15,423 |
| FY2025 | 187,267 | (9,169) | (8,182) | (2.06) | 21,282 |
Source: consolidated statements across filings; older years from the standardized feed [9] [1] [2] [10]. Click any linked figure to open the filing page with the row highlighted.
Analyst Consensus
Mean target
Median target
High target
Low target
Street ratings: 5 strong buy, 3 buy, 13 hold, 1 strong sell. Consensus: Buy.
Estimate source: S&P Capital IQ (CapIQ) consensus, as of 2026-08-01. Estimate figures are S&P Capital IQ consensus (vendor data — no filing page links). EPS and net income use the normalized (adjusted) consensus where the street reports it. Line-item analyst models (segments, drivers, KPIs) are in the Visible Alpha tab.
Traceability
358 of 376 figures on this page (95%) link to the filing page where they are printed — click a linked figure to open the source PDF at that page with the row highlighted. Unlinked figures come from standardized data feeds or pre-filing years.
years FY2021-FY2022 income-statement and cash-flow figures are the comparative columns of the FY2023 Form 10-K (p.146 / p.145); FY2023-FY2025 are from the FY2025 Form 10-K (p.160 / p.162).
Balance-sheet FY2021 is the comparative column of the FY2022 Form 10-K (p.149); FY2022-FY2023 from the FY2023 Form 10-K (p.147); FY2024-FY2025 from the FY2025 Form 10-K (p.161).
Ford reports two revenue lines on the income statement — Company excluding Ford Credit and Ford Credit. The revenue_breakdown statement instead uses Note 25 external segment revenues (Ford Blue, Ford Model e, Ford Pro, Ford Credit); these four do not sum exactly to Total revenues because a small unallocated/Ford Next/Corporate Other remainder (US$10-144M) is omitted, so no sum-check is asserted on the total.
Segment EBIT/EBT (segment_profit) is shown only for FY2023-FY2025. Ford adopted the Ford Blue / Model e / Pro segment structure reporting Segment EBIT/EBT from FY2023; FY2021-FY2022 were reported on a segment 'Income/(Loss) before income taxes' basis (a different metric) and are left blank rather than mixing bases.
FY2025 was a GAAP net loss of US$(8,182)M / US$(2.06) diluted EPS, driven by US$17.4B of special items — chiefly an US$8.1B Ford Model e EV asset impairment, US$1.3B of asset write-downs, US$1.2B of EV program-cancellation charges, and a US$3.2B impairment of the BOSK JV investment (recorded through Equity in net loss of affiliated companies). The standardized data feed matches the filing on every FY2025 line.
long_term FY2016-FY2020 figures are from the standardized data feed (SEC XBRL) and are shown without page links; FY2021-FY2025 are linked to the filings. Net income attributable to Ford is linked only for FY2021-FY2025 (the feed does not carry the attributable figure for earlier years).
Quarterly Q4 FY25 income and all derived quarterly cash-flow single quarters were cross-checked against data/financials/cash_flow_quarterly.json and reconcile exactly (e.g. Q4 FY25 operating cash flow US$3,884M).
Ford Motor Company's management explains the business in its own materials. The slides below do the most of that work, pulled from the documents preserved in Sources. Each source link opens the complete presentation at that slide in a new tab.
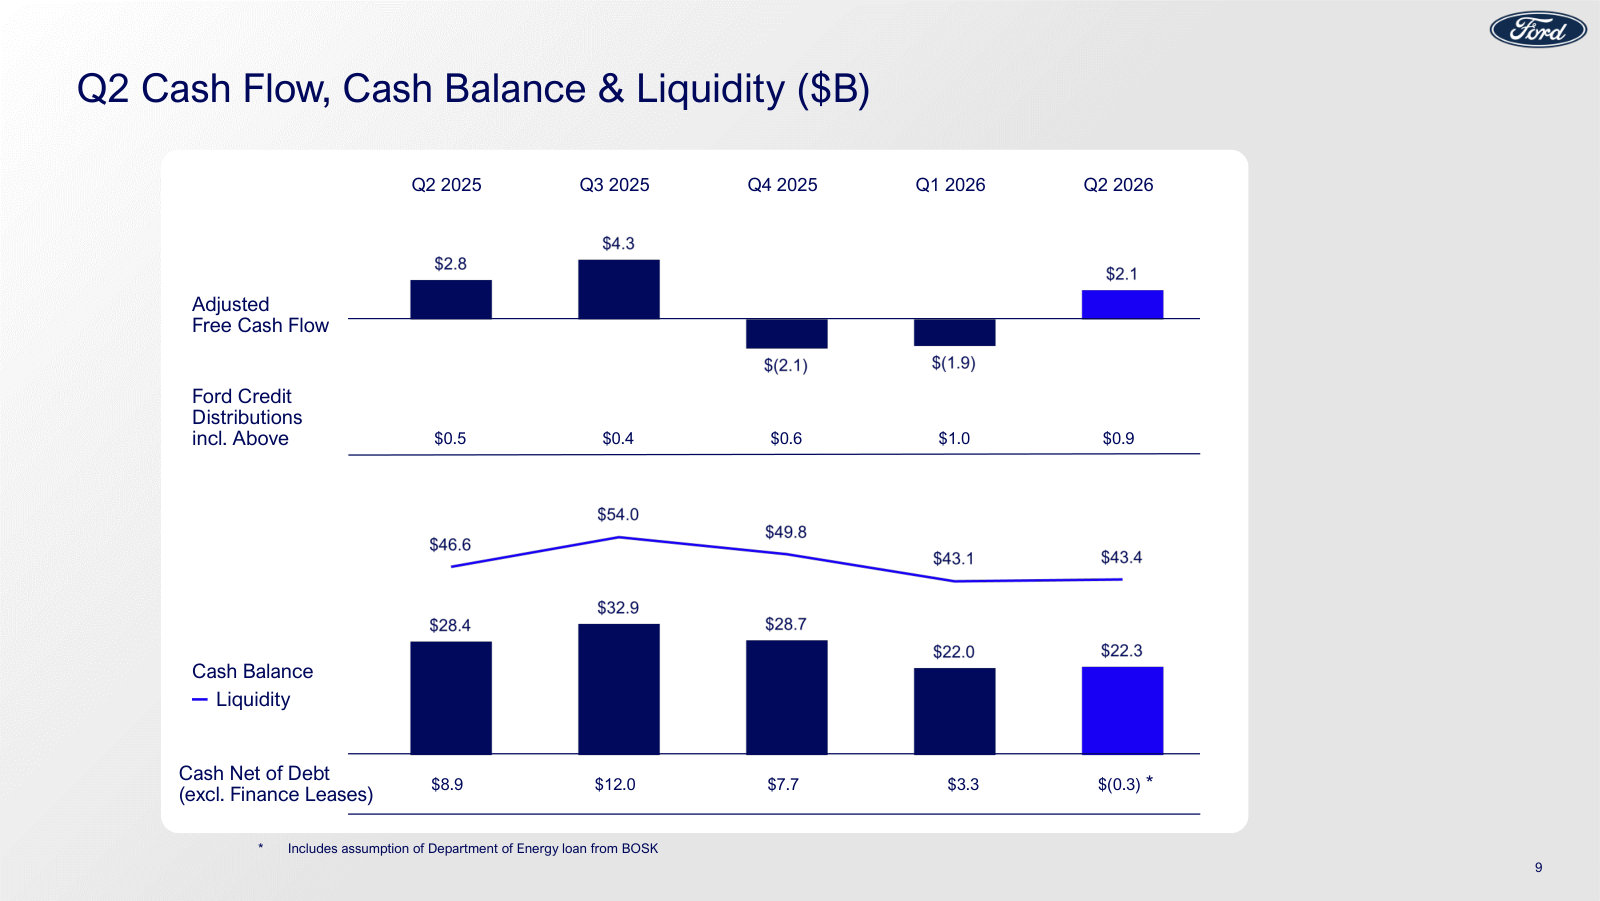
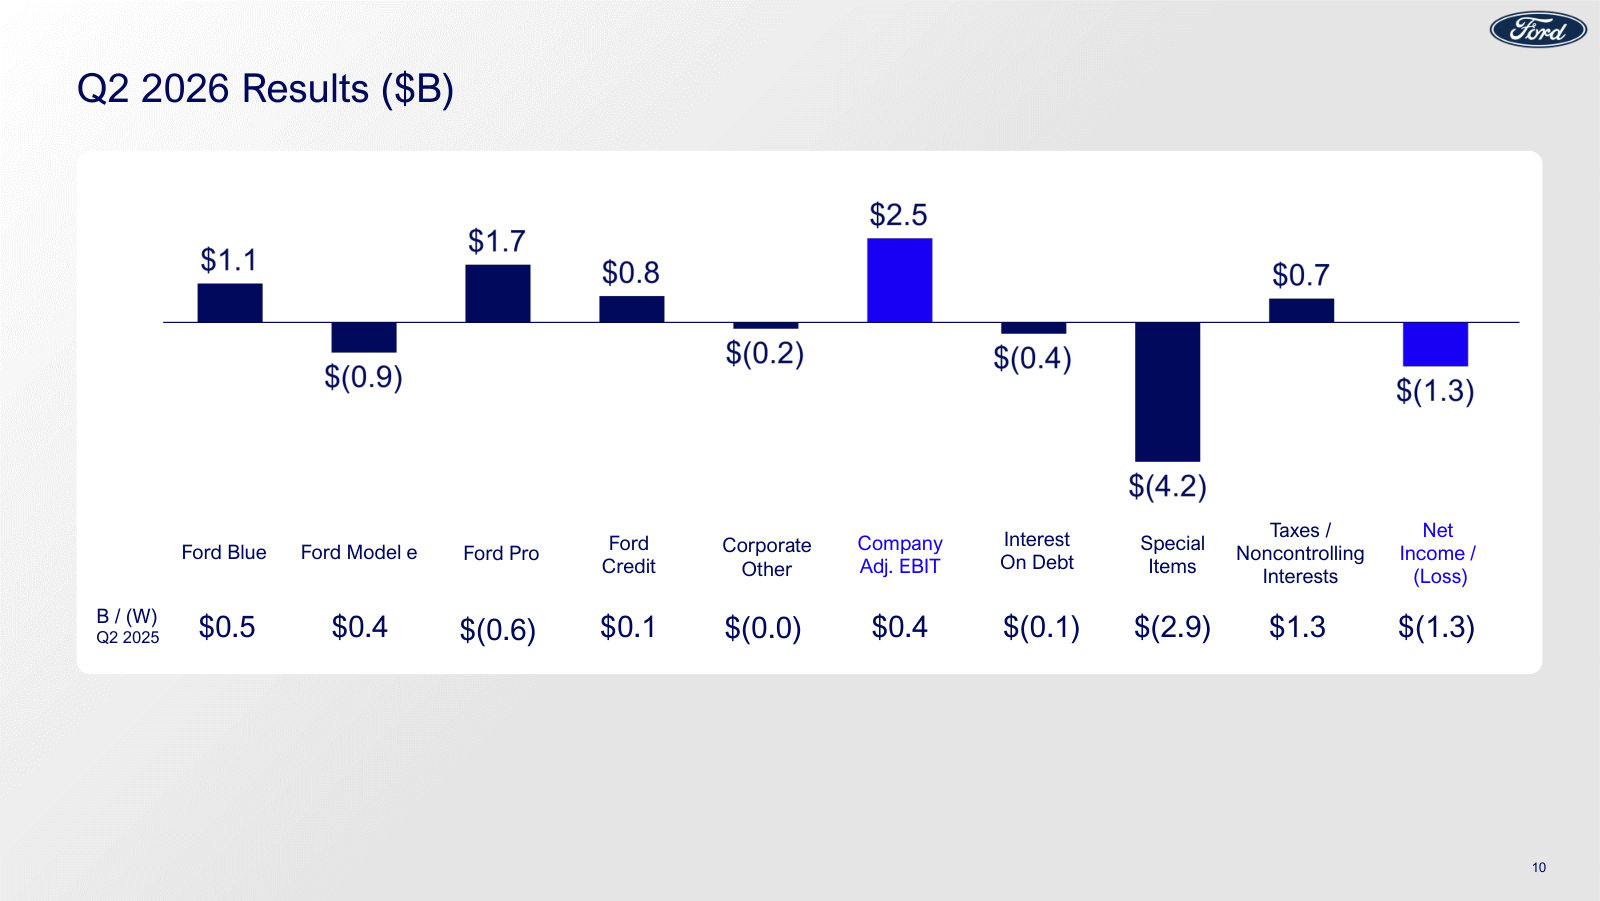
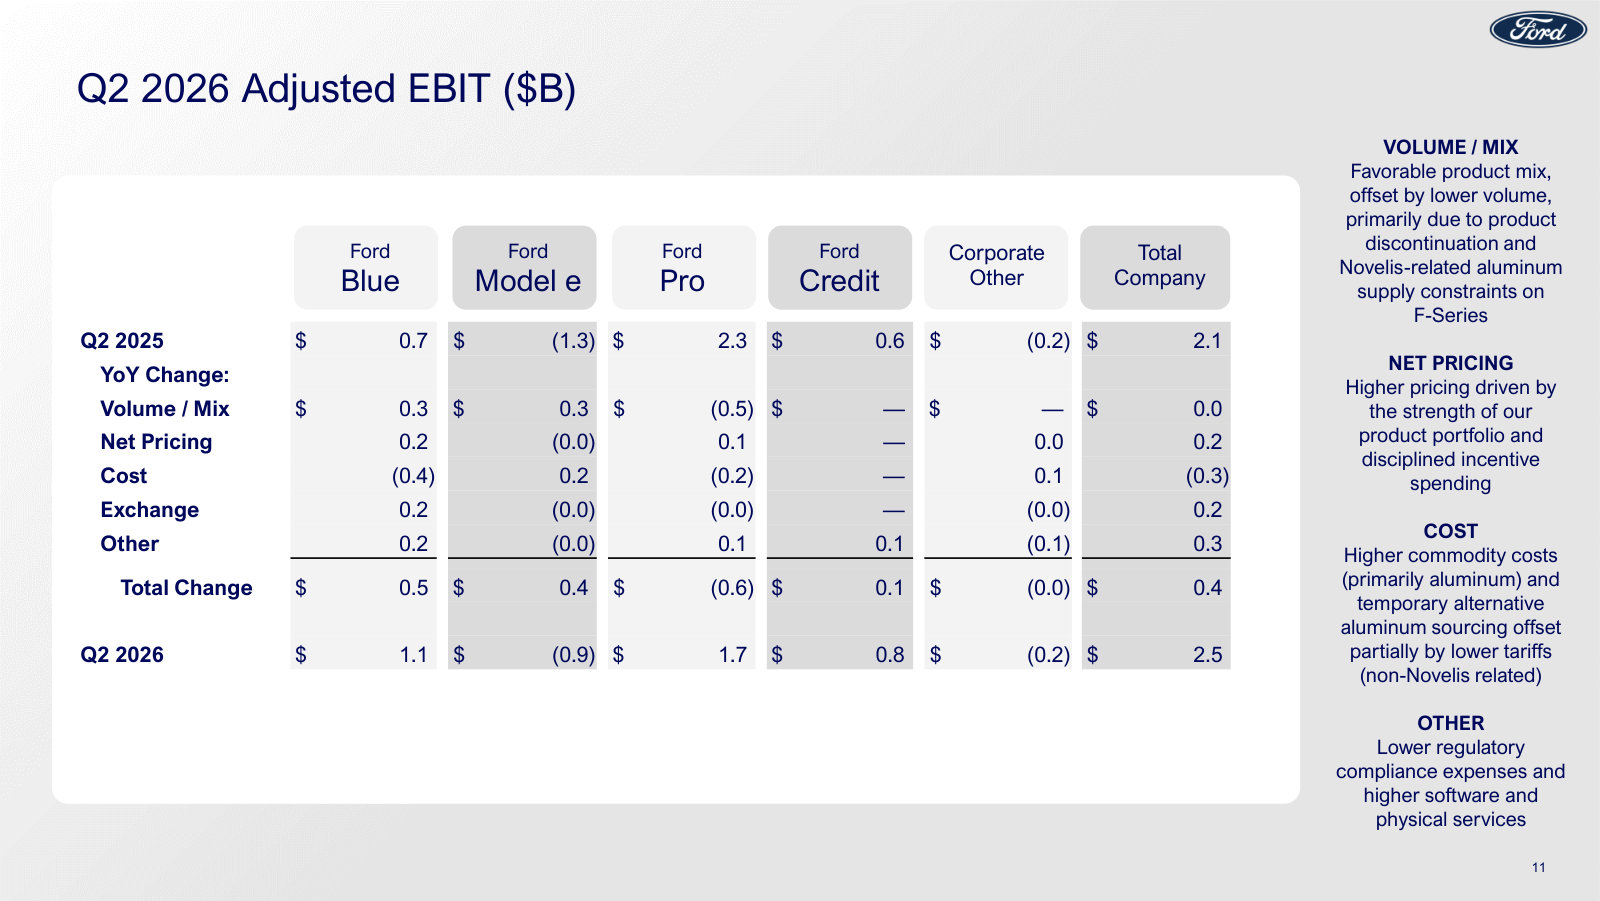
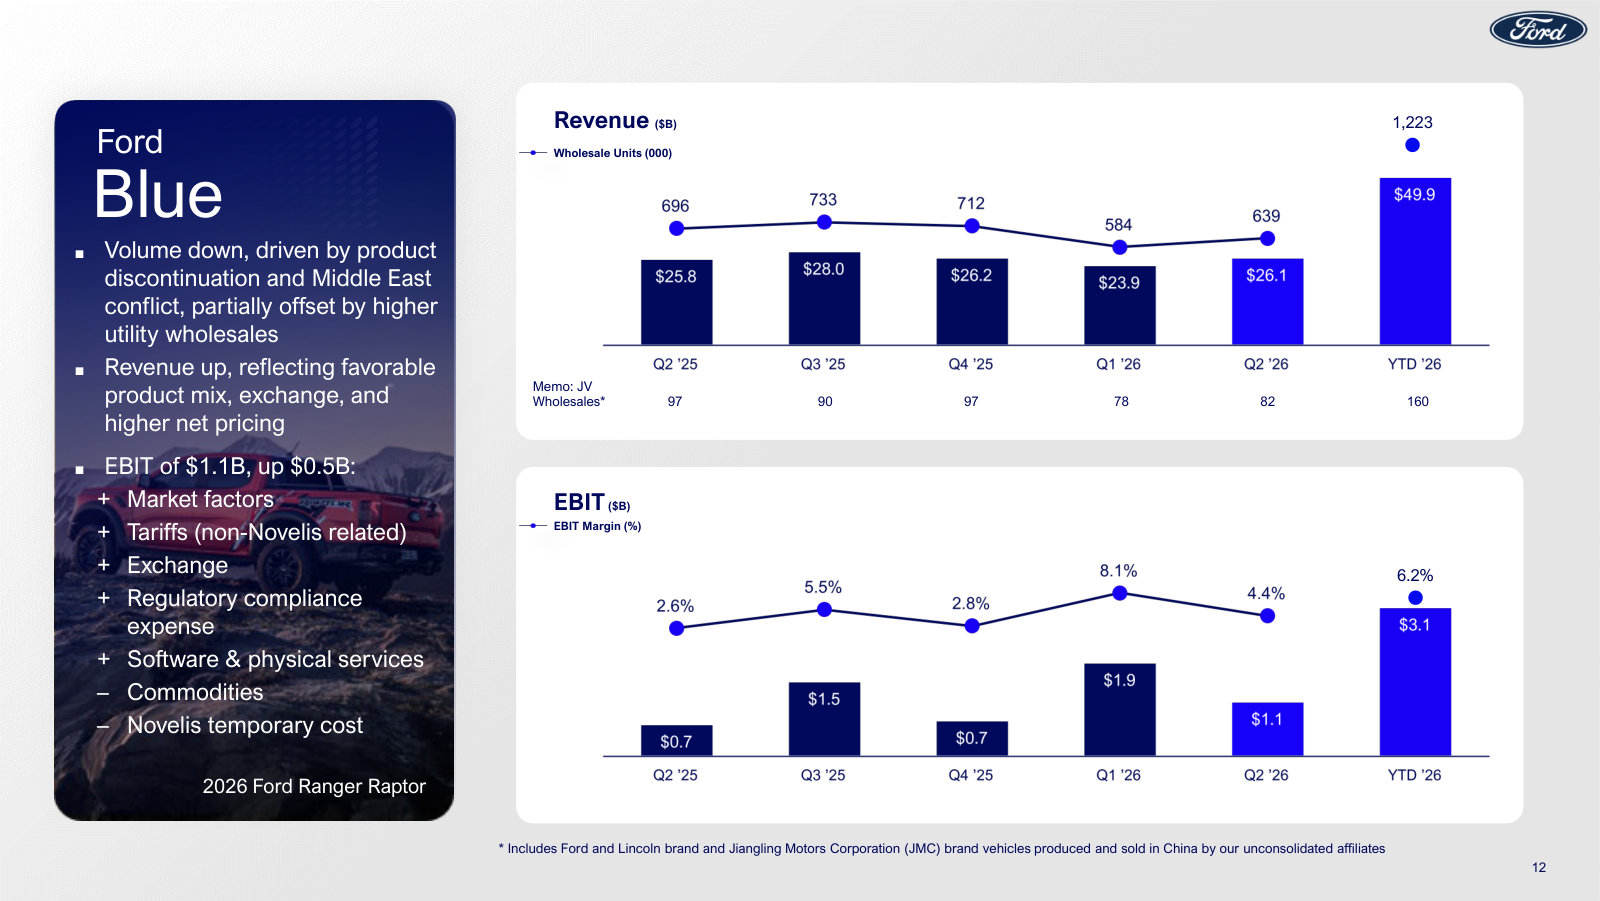
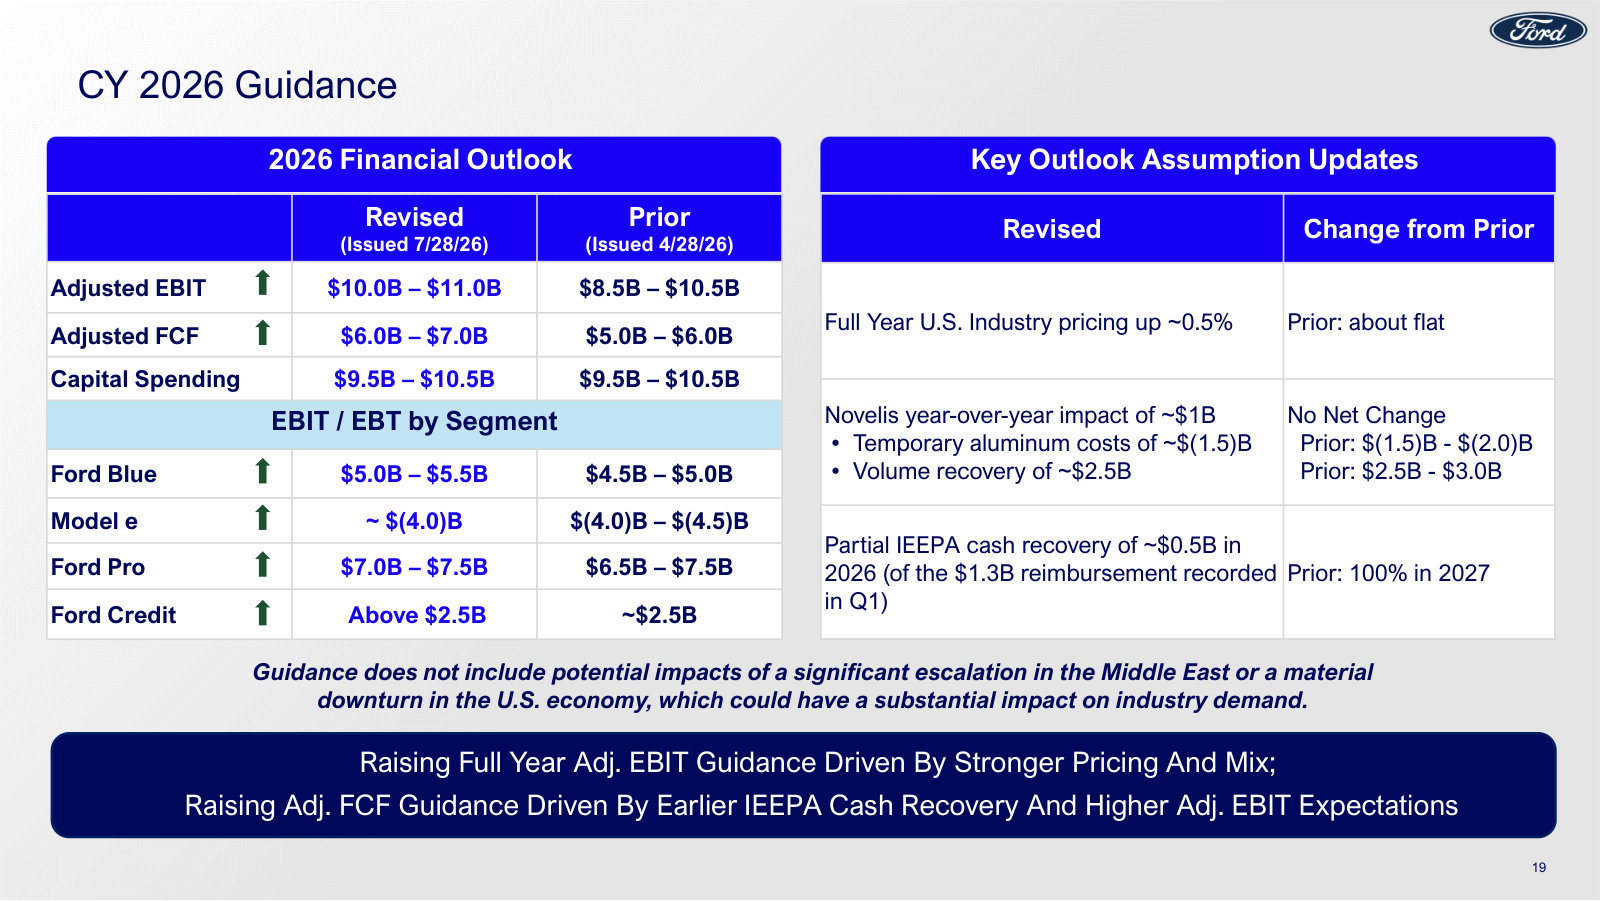
Q2 2026 Earnings Presentation — Q2 2026
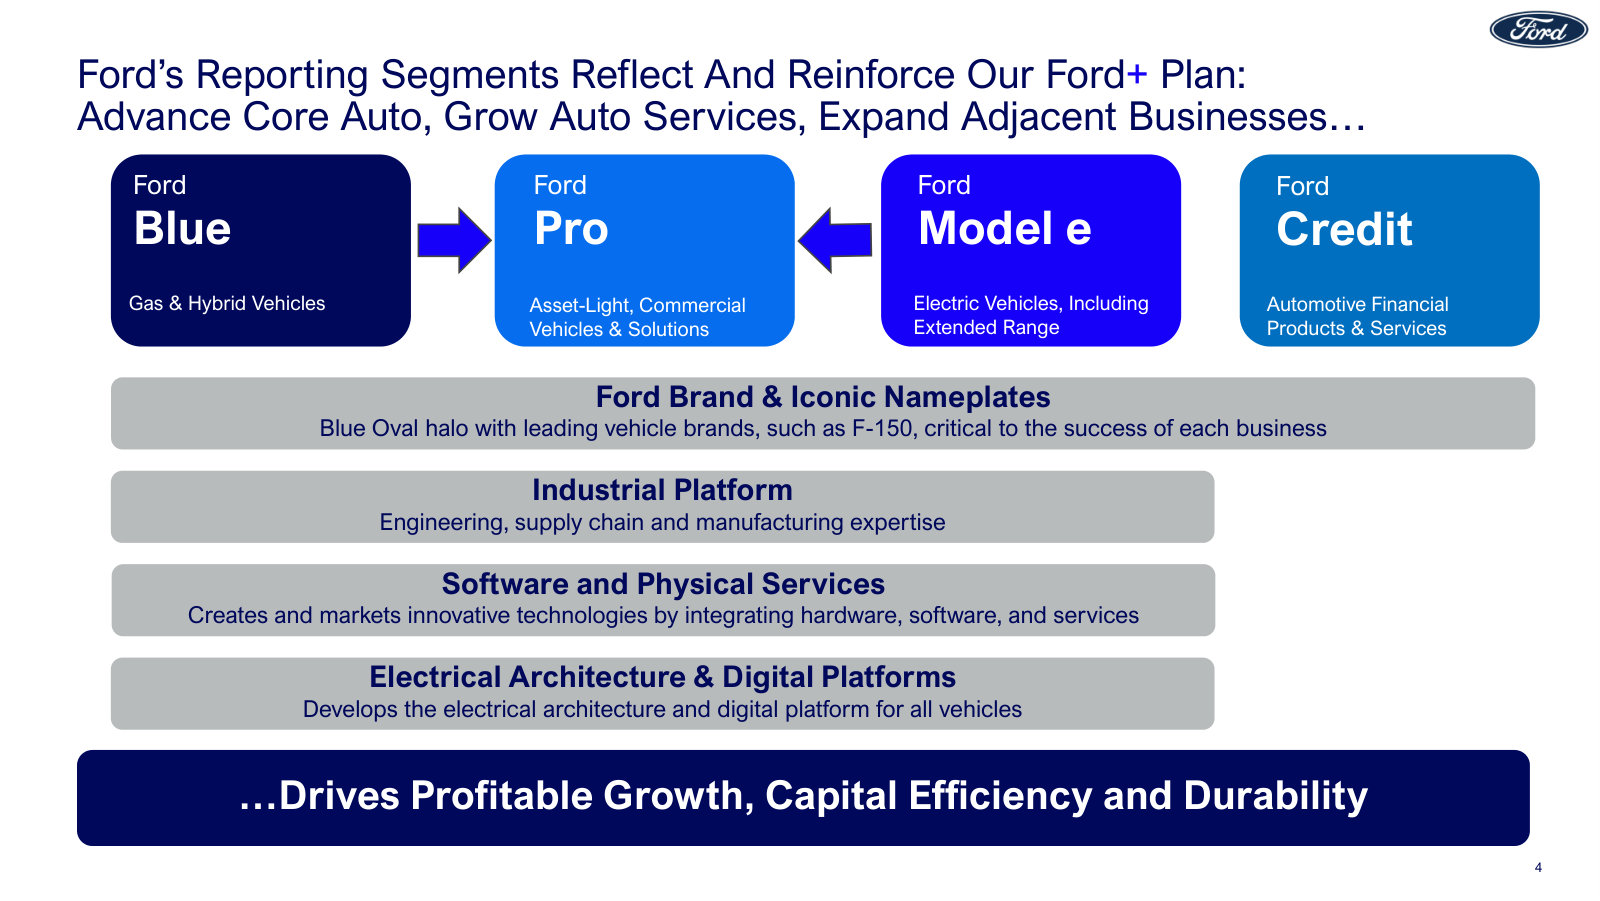
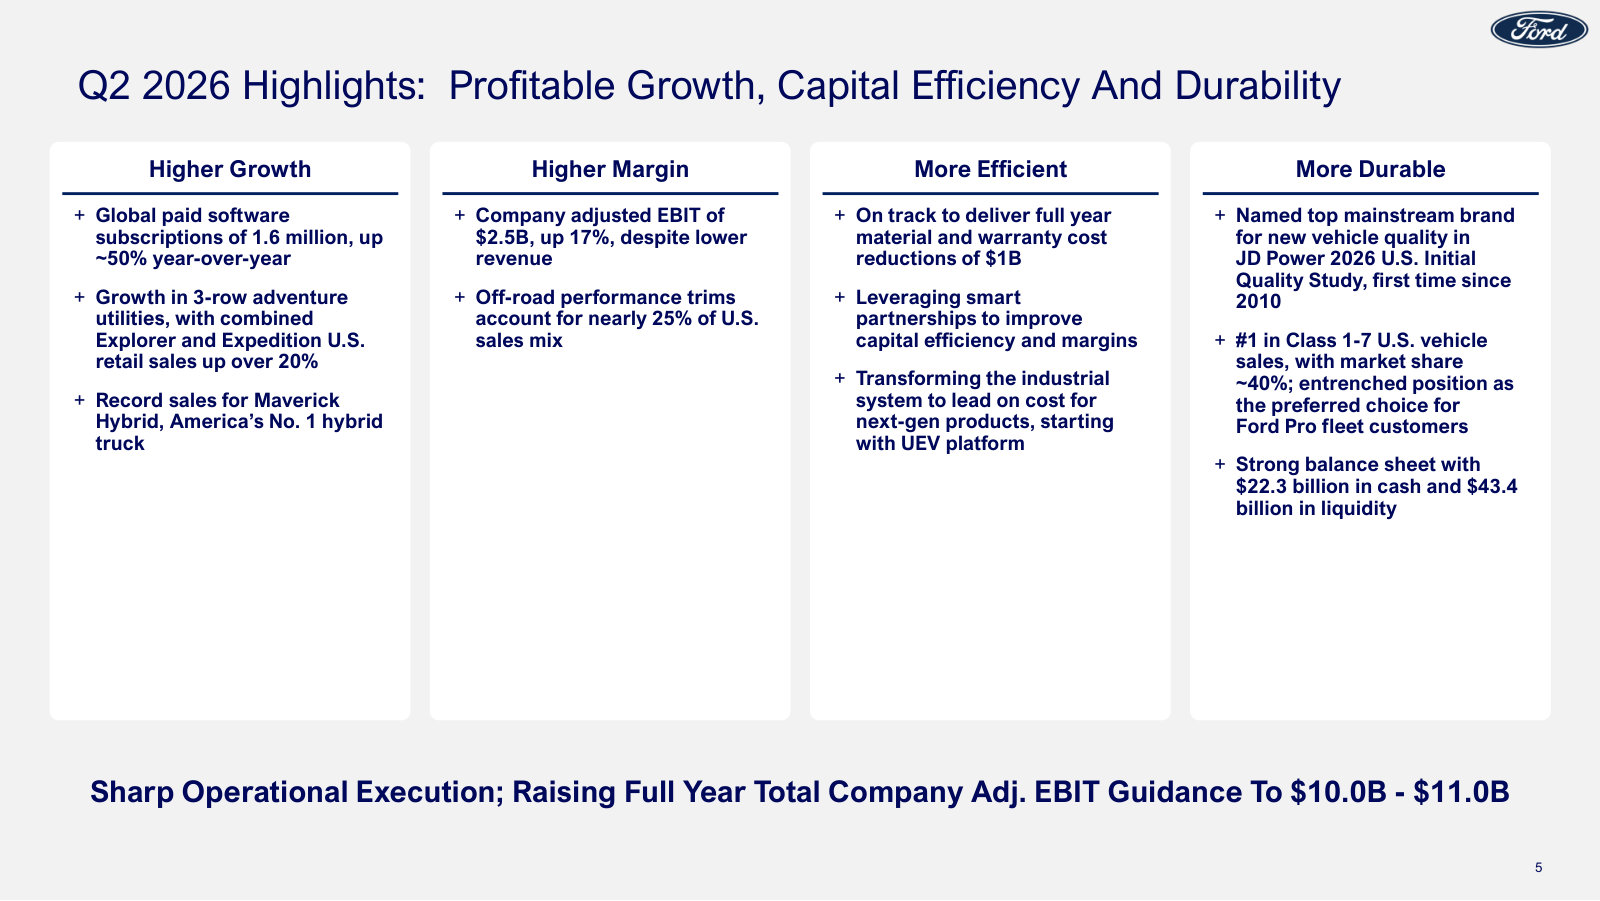
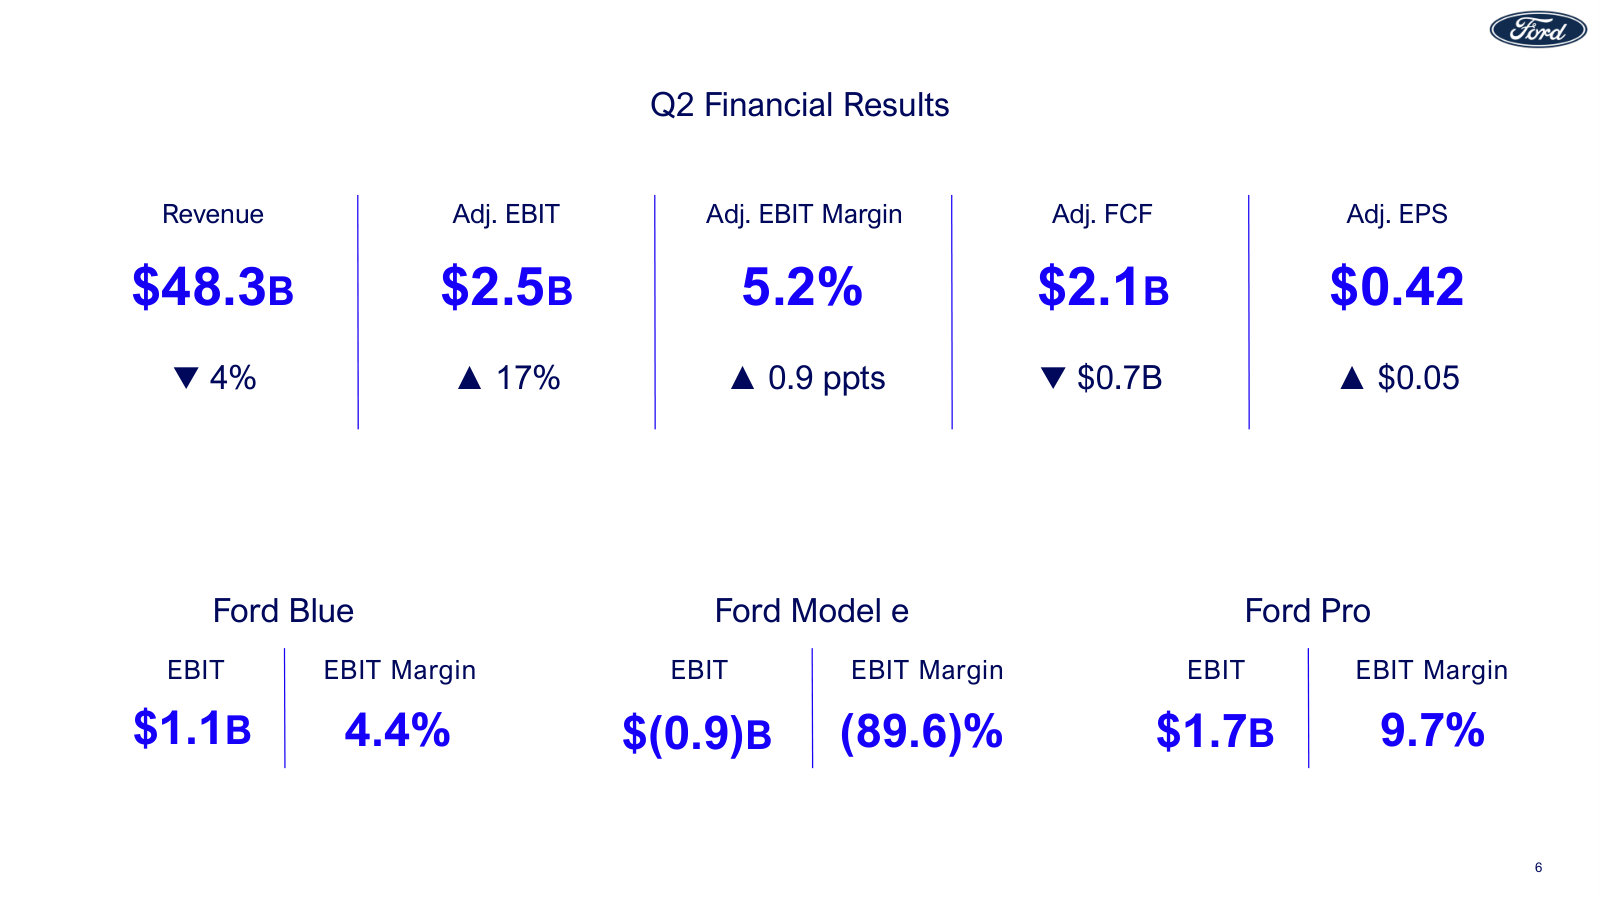
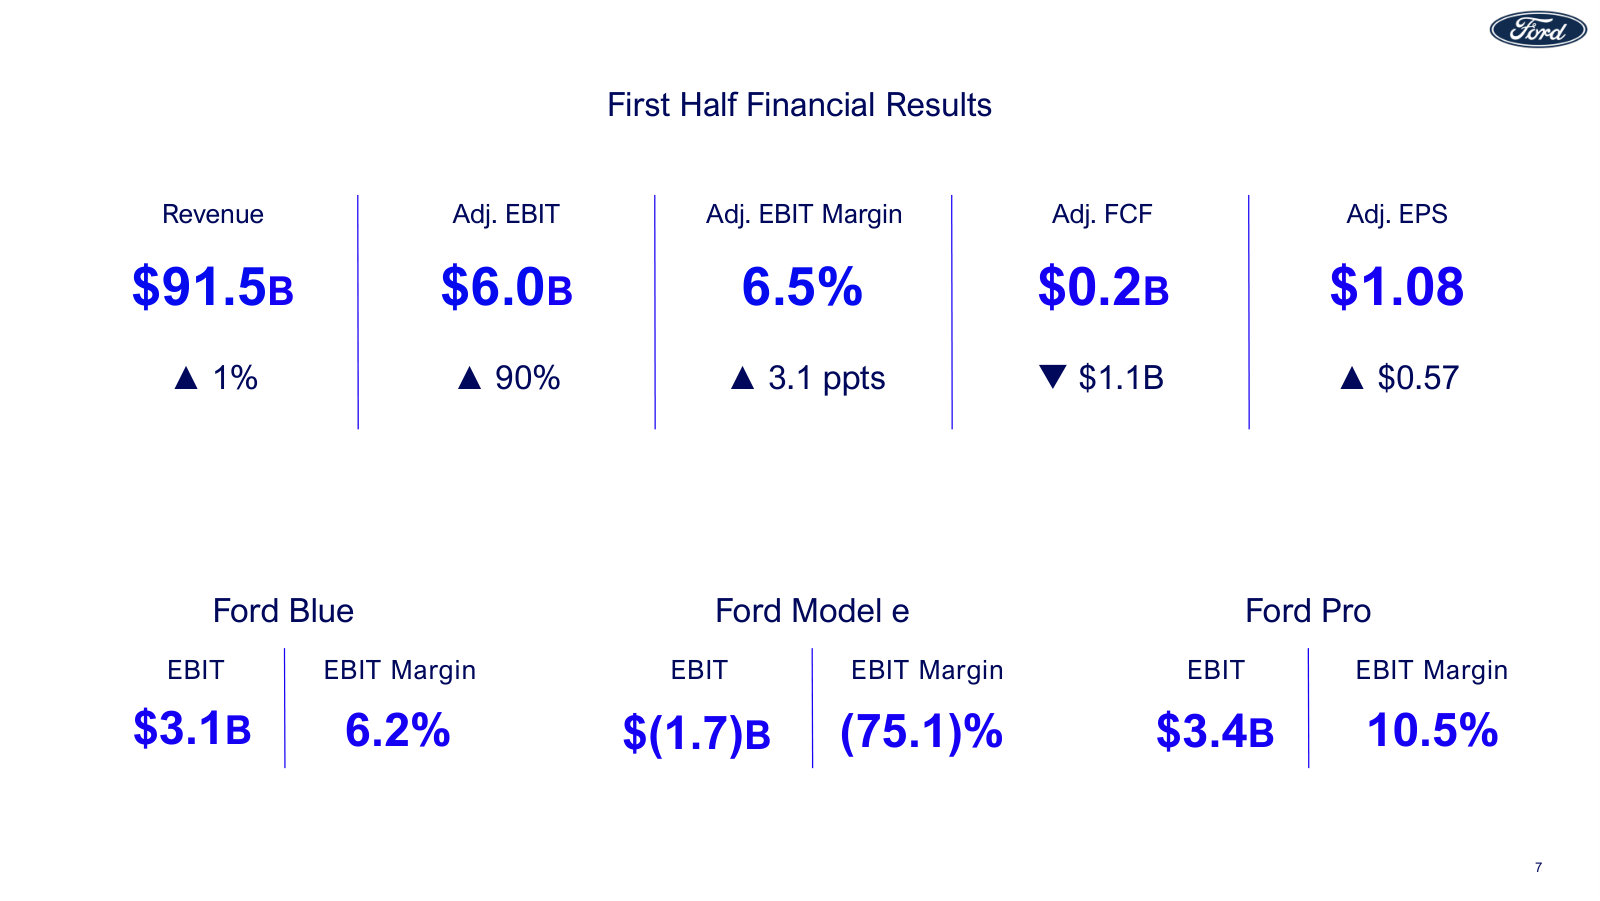
The newest and fullest current picture: the Ford+ operating map, all four segments, first-half results, and raised 2026 guidance. · Open the full document →
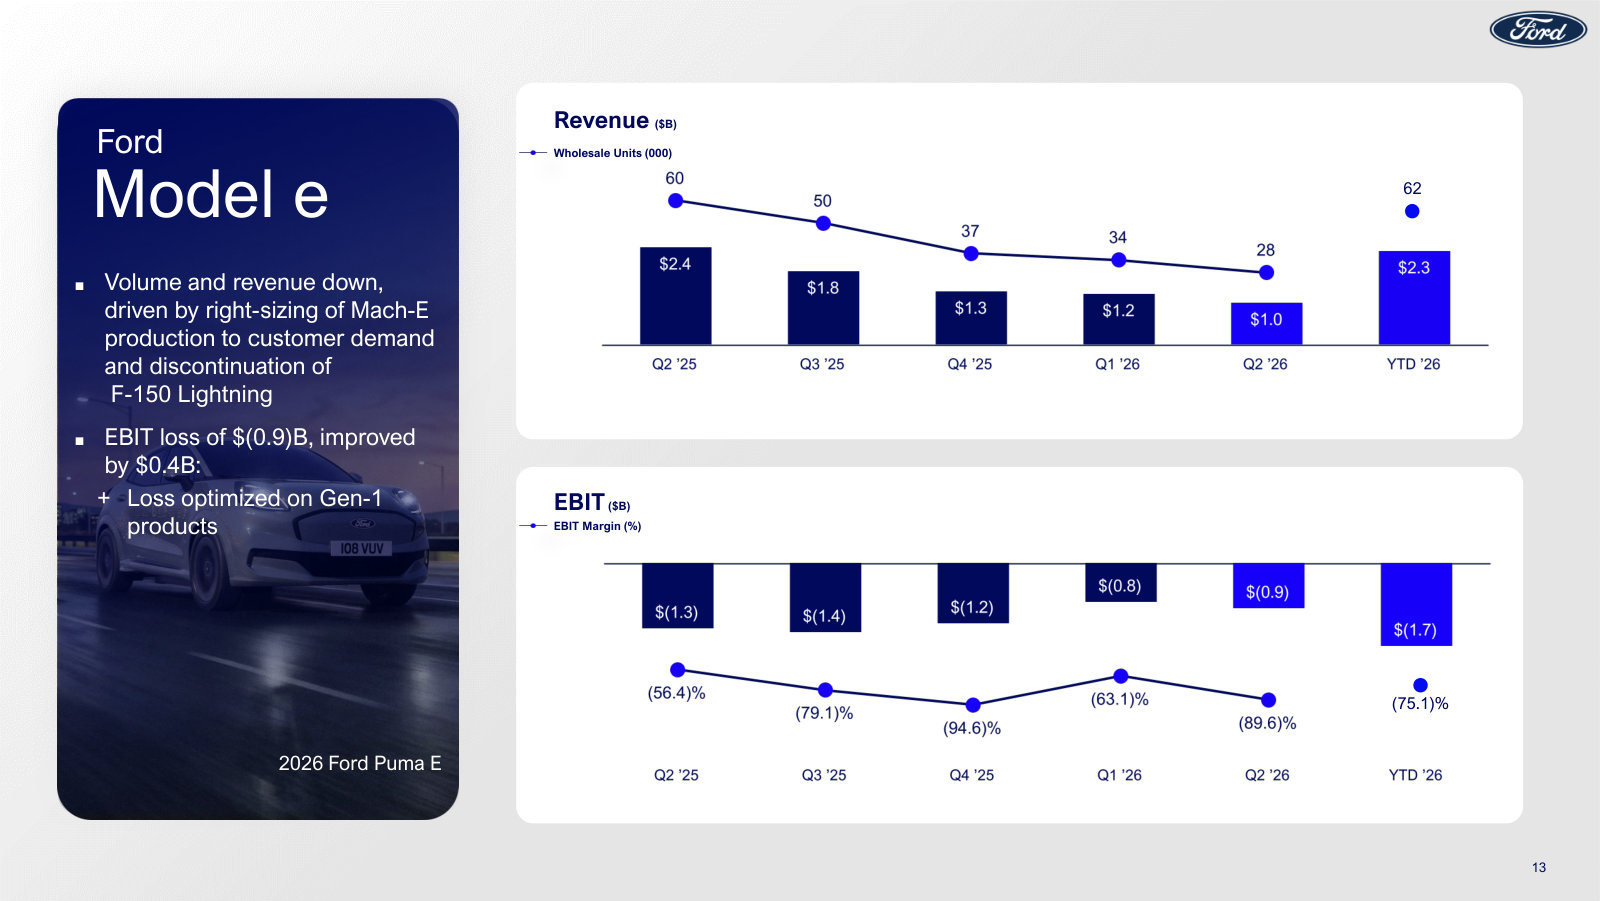
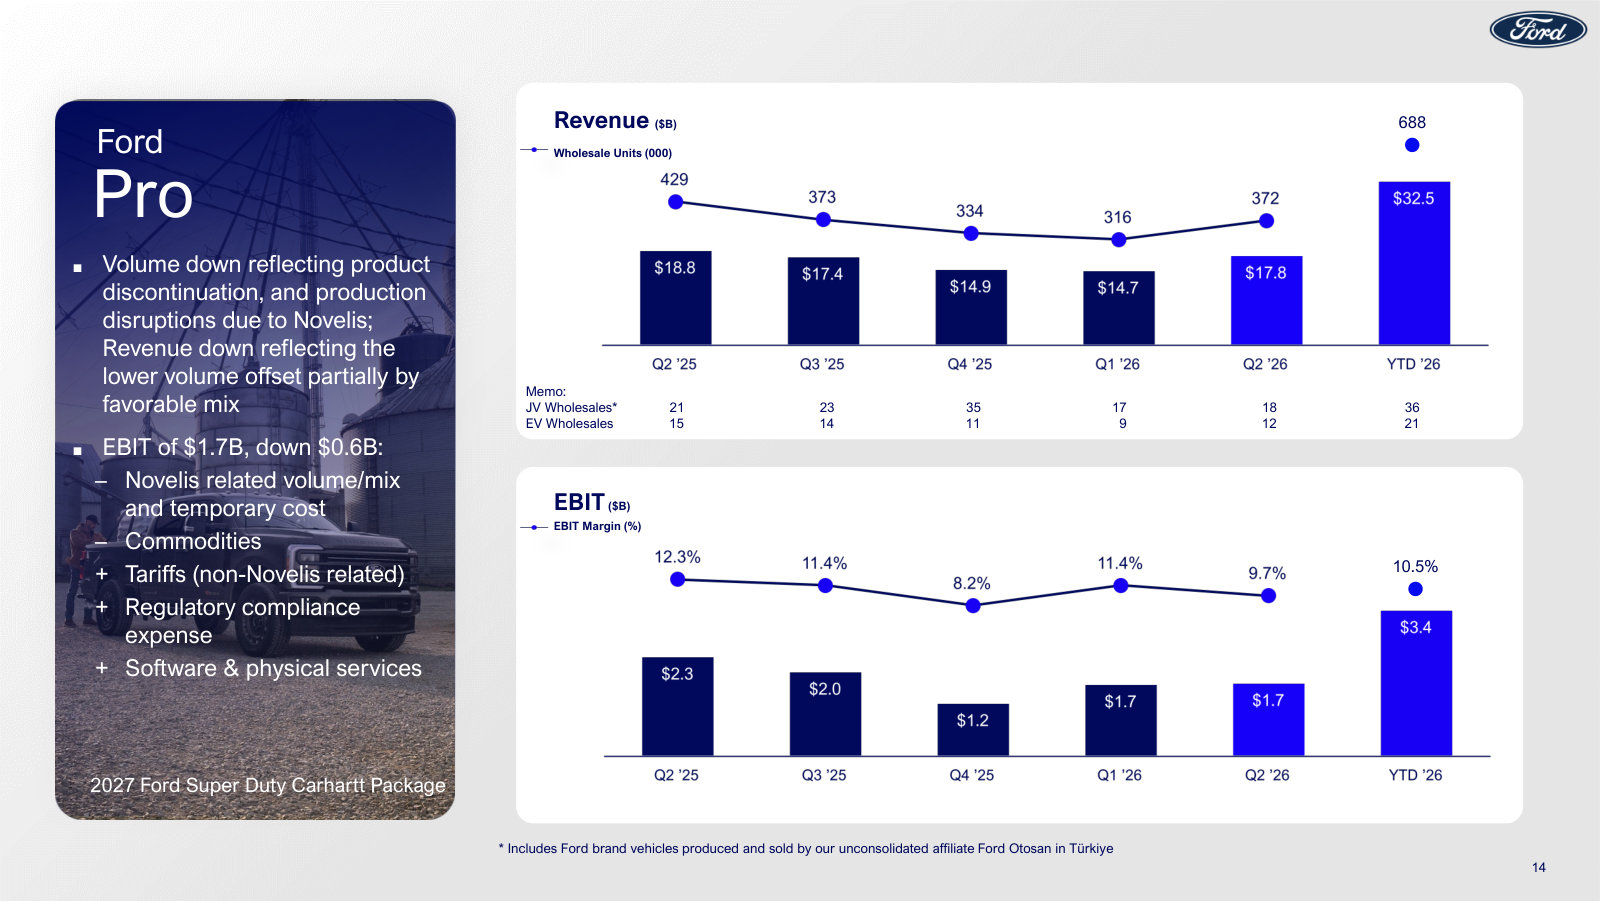
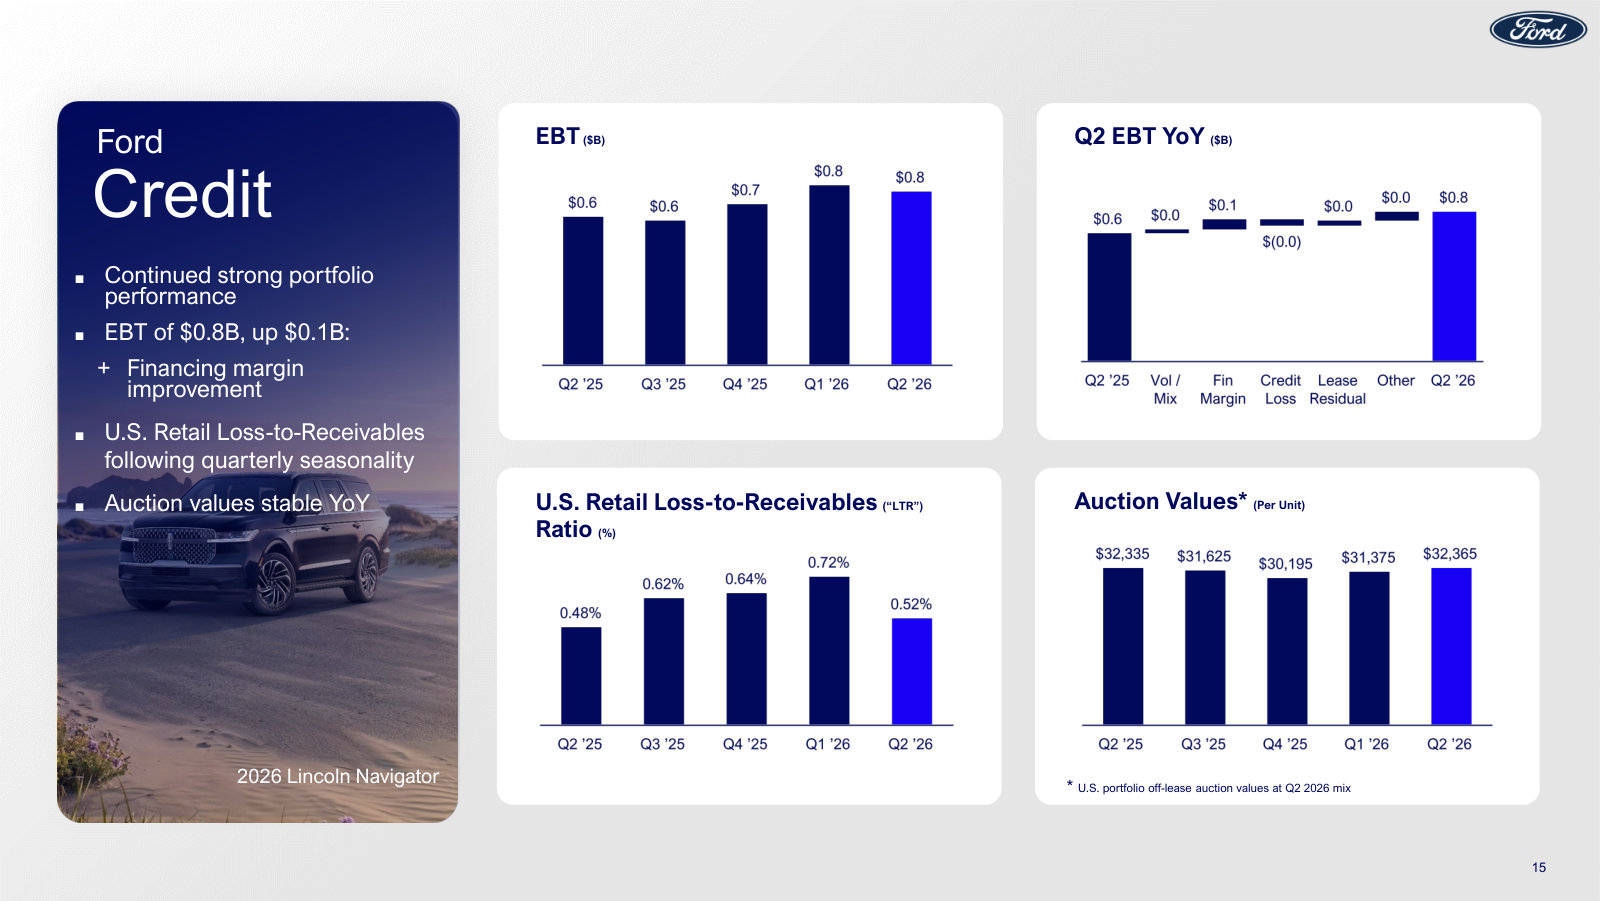
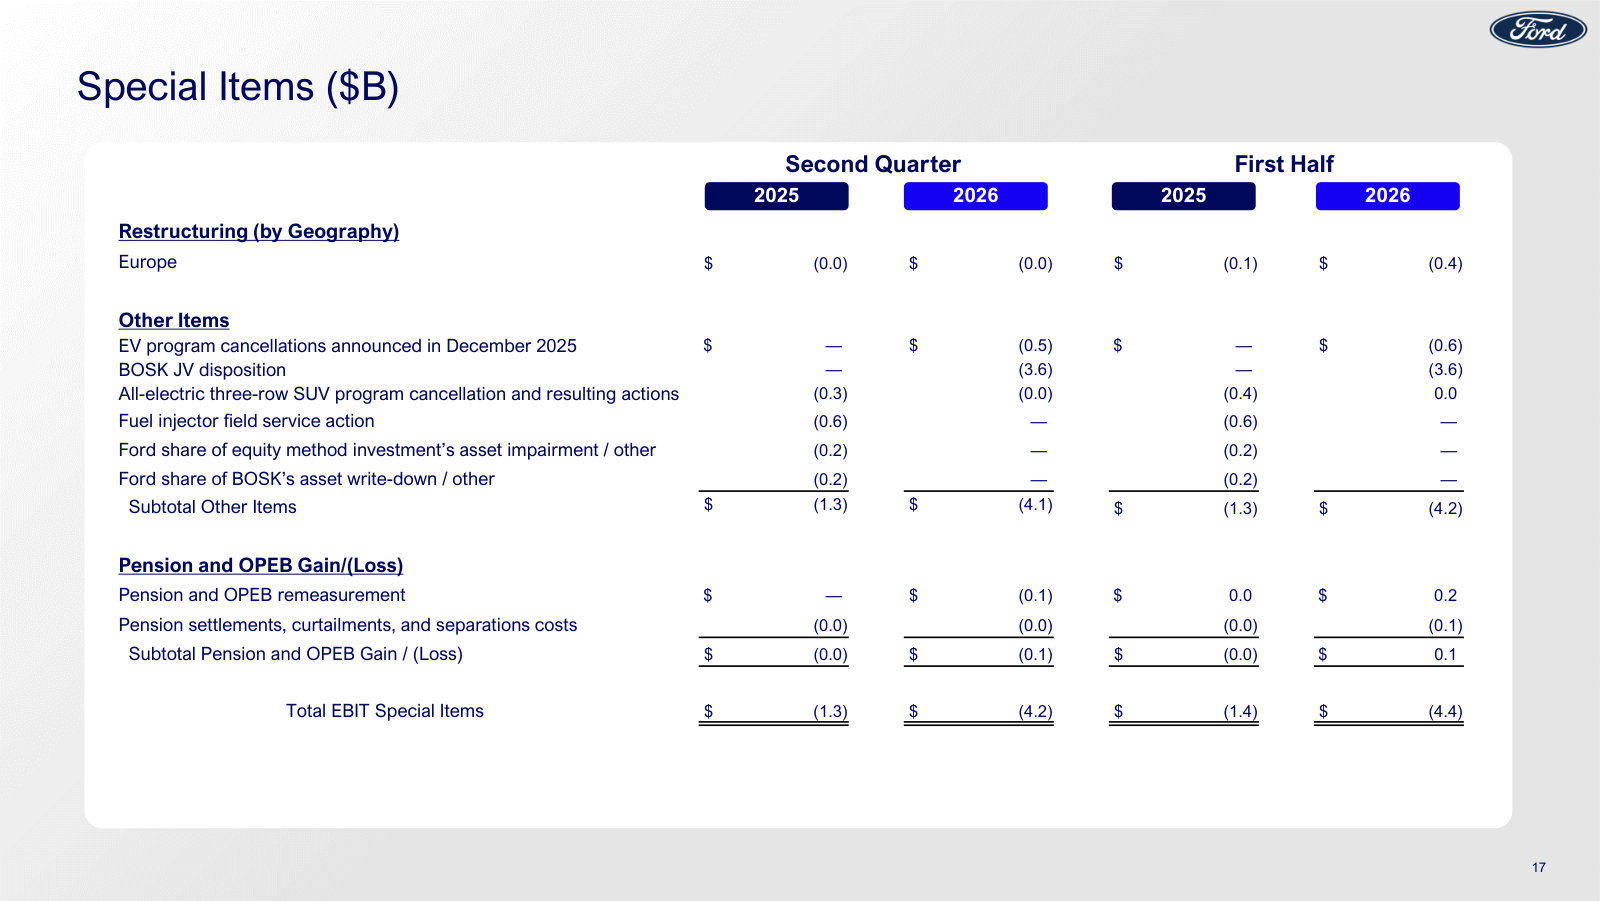
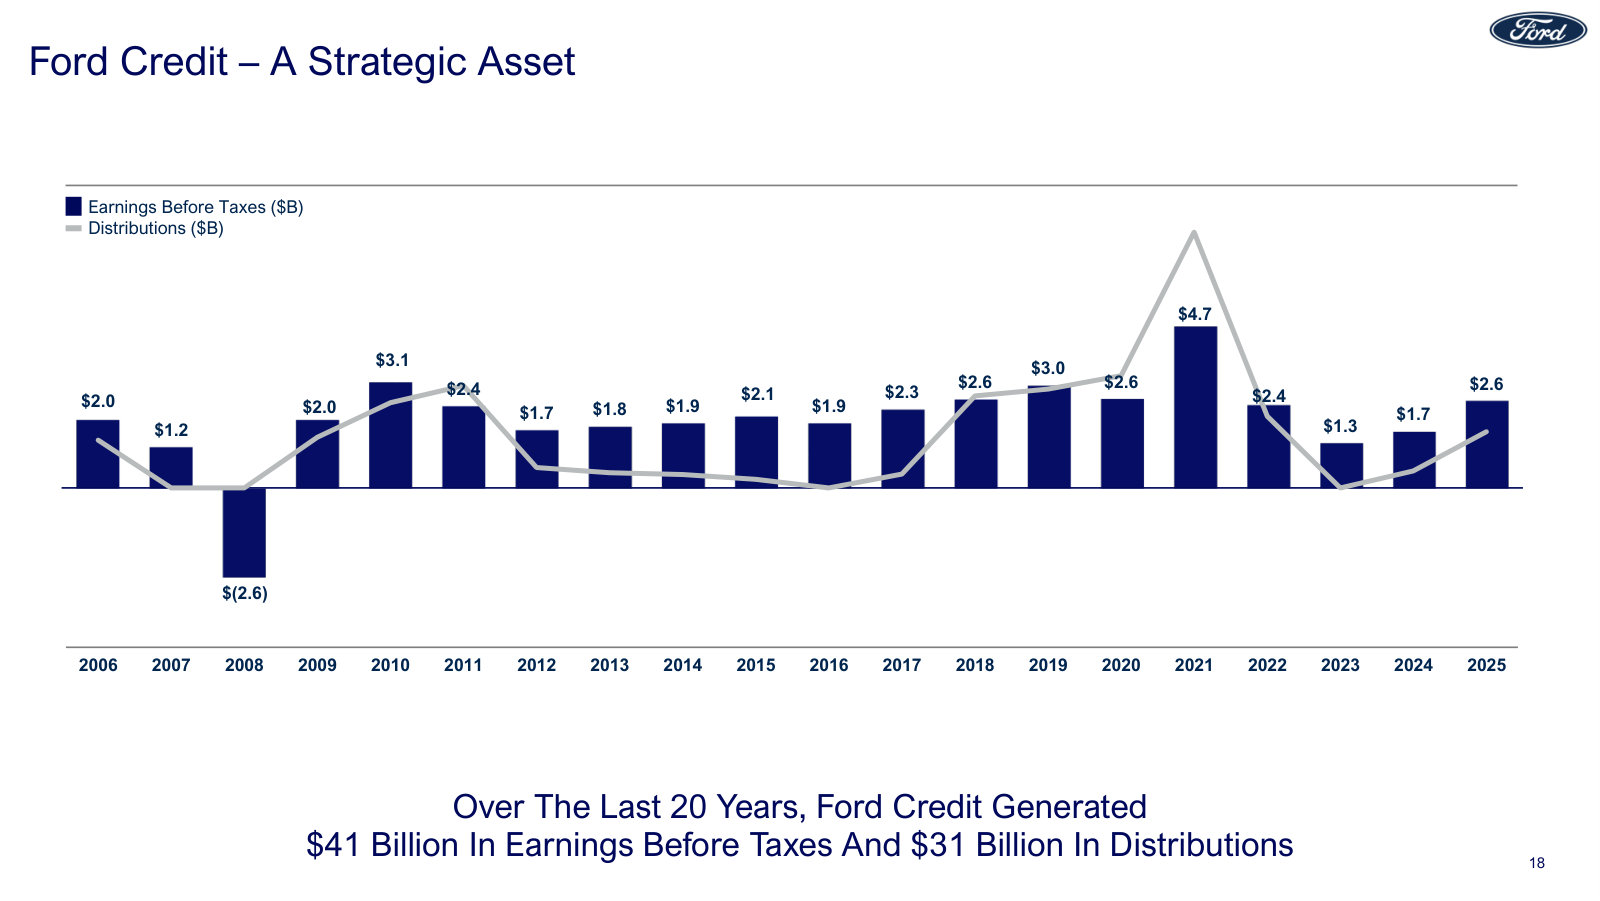
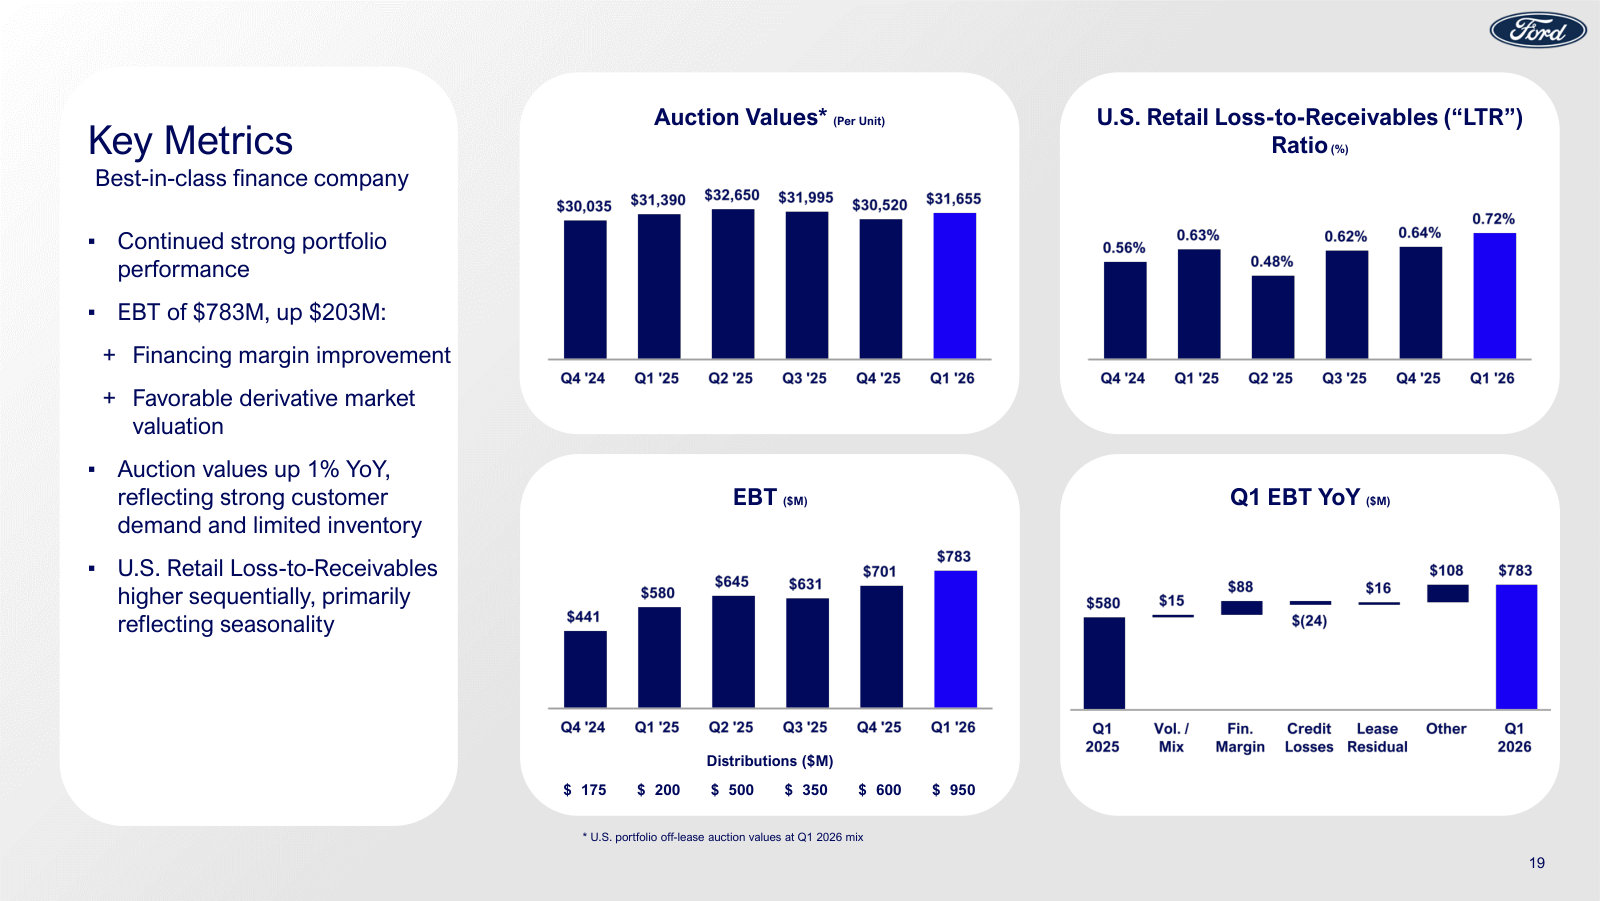
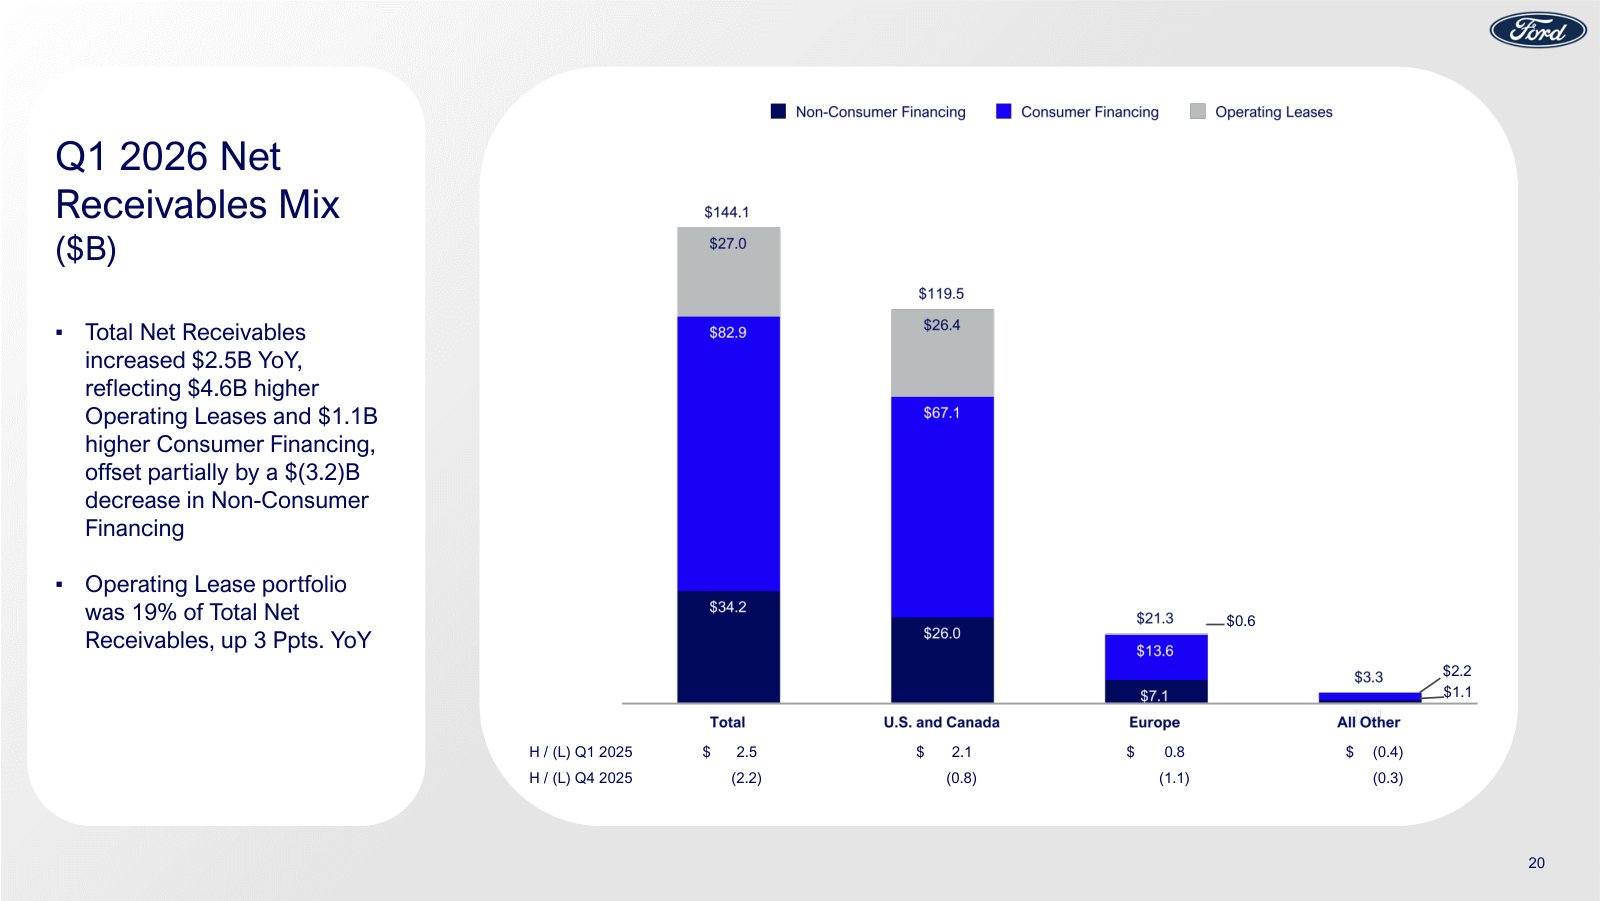
Q1 2026 Fixed Income Investor Presentation — Q1 2026
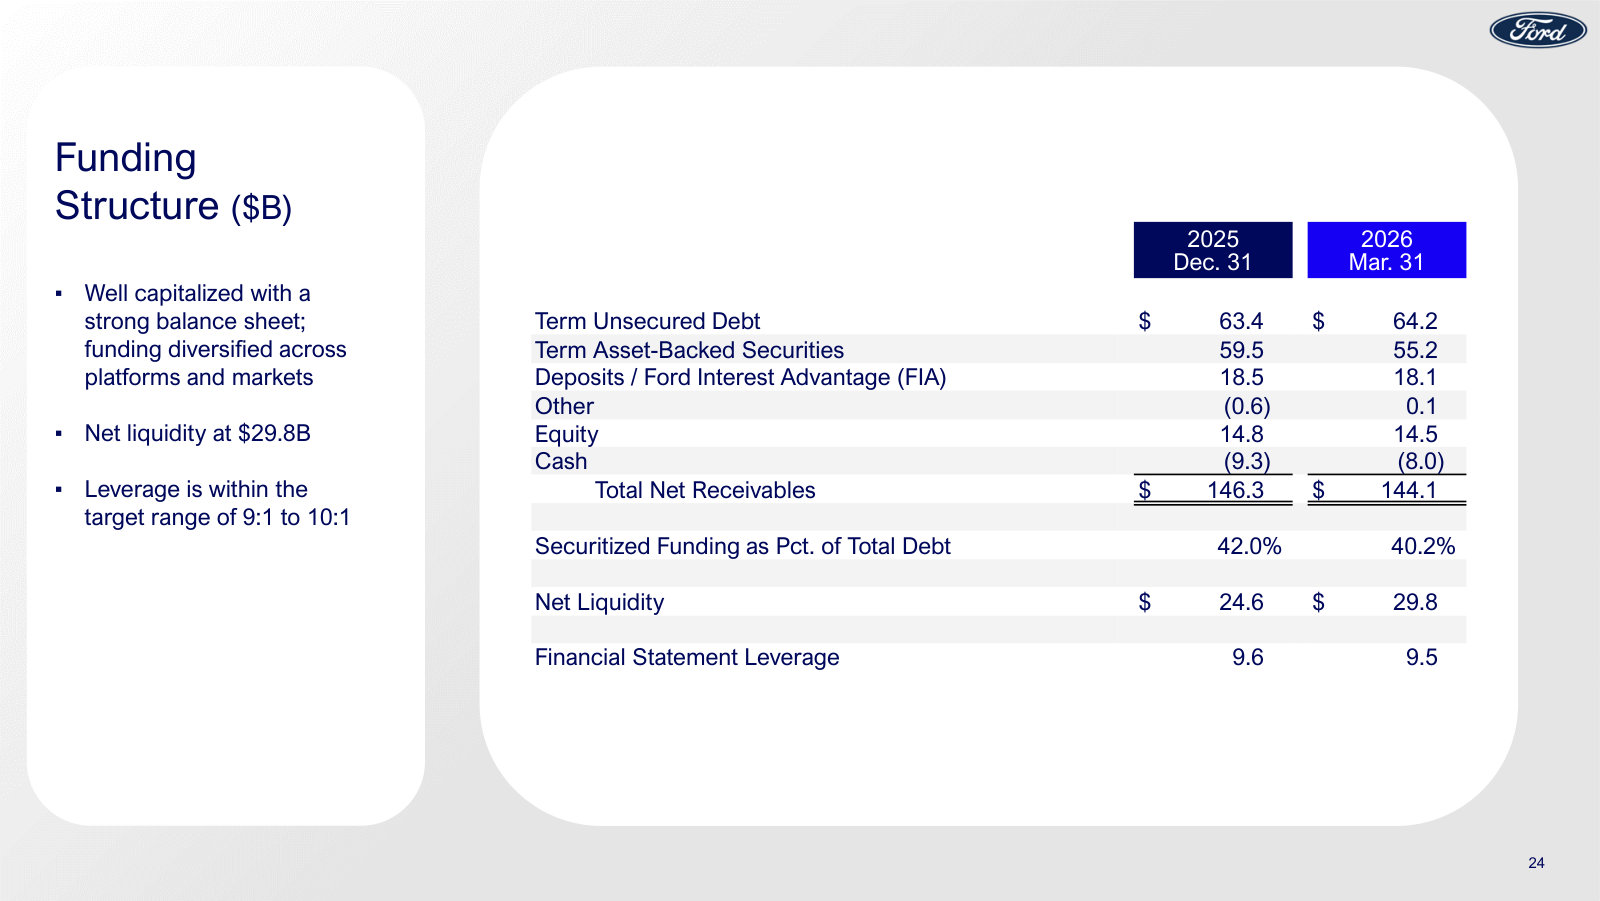
The fixed-income deck's distinctive content: a deep look at Ford Credit — the captive finance arm the earnings decks only summarize. · Open the full document →
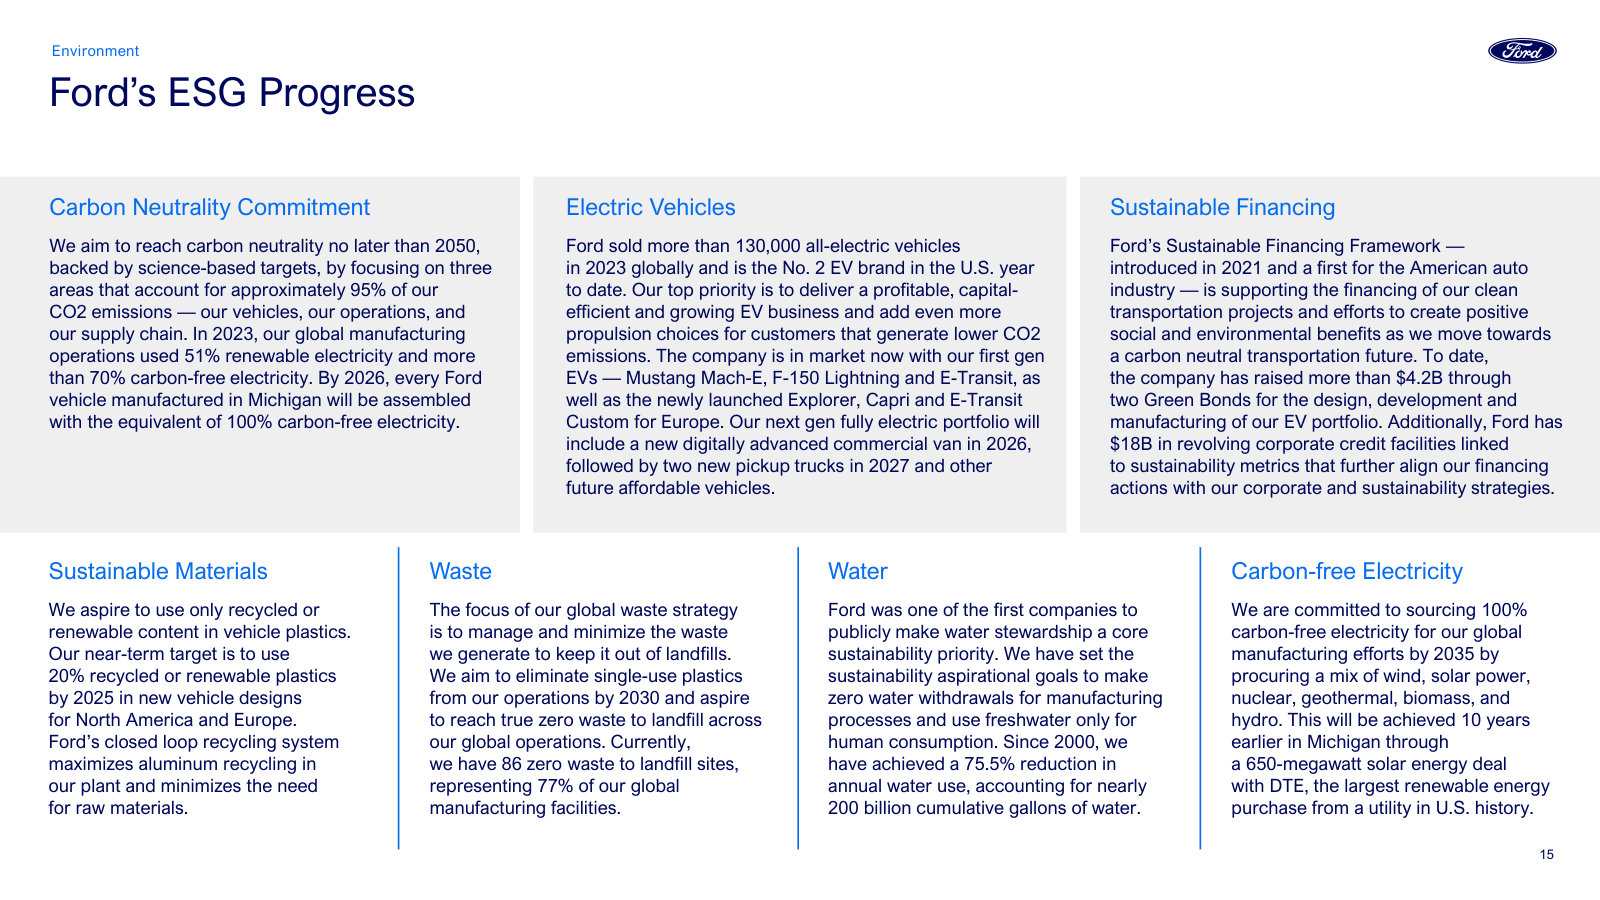
Environmental, Social, and Governance Review — 2024
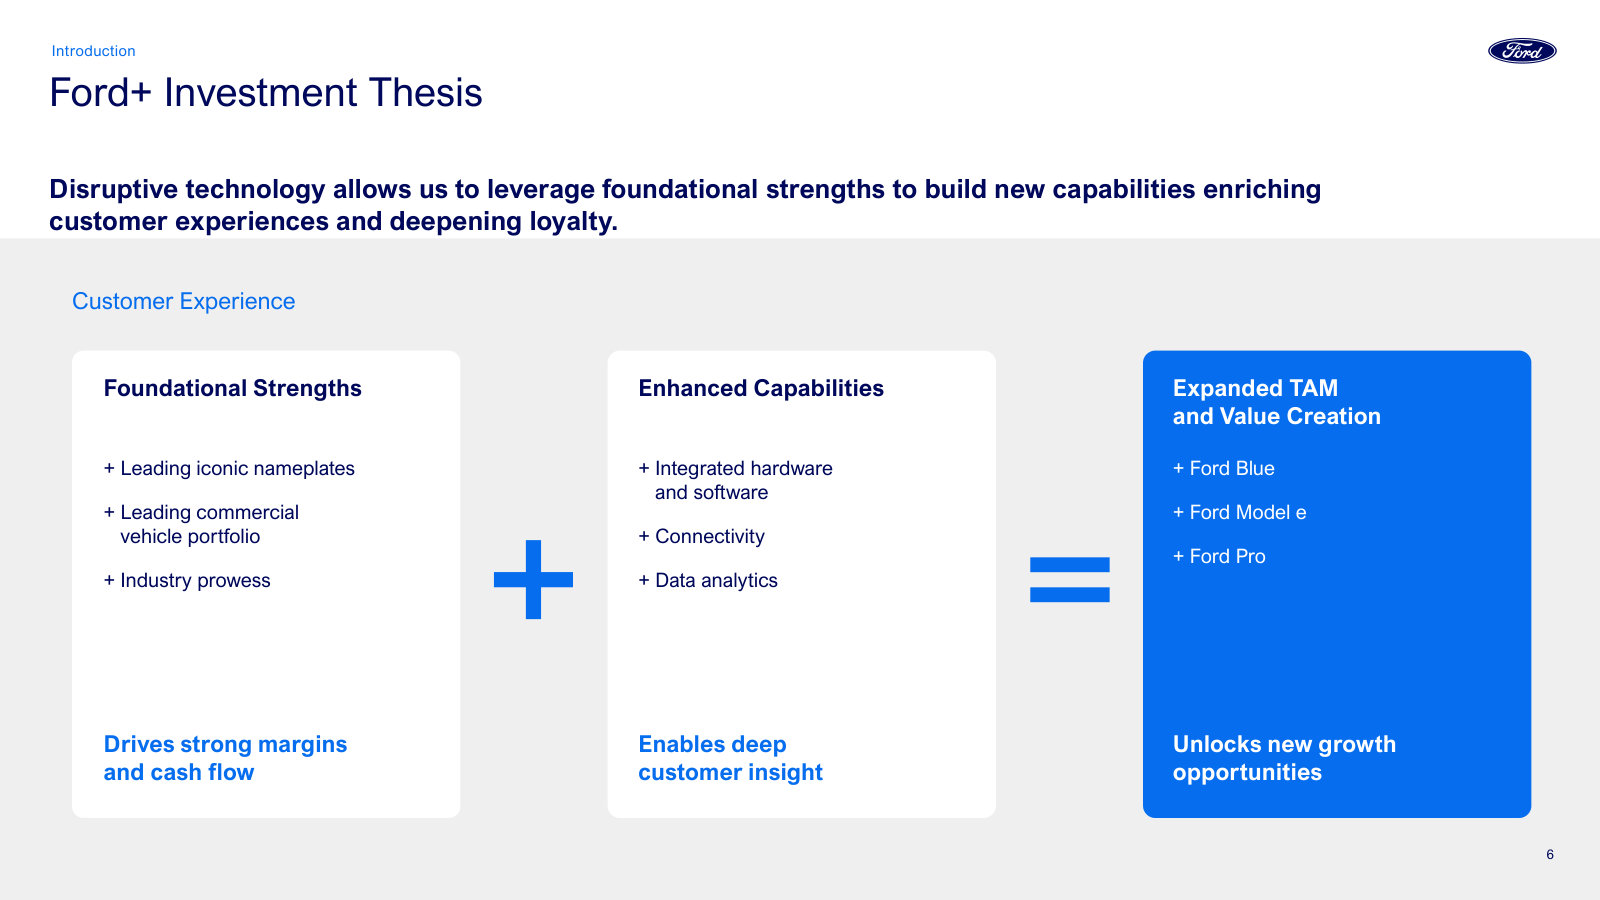
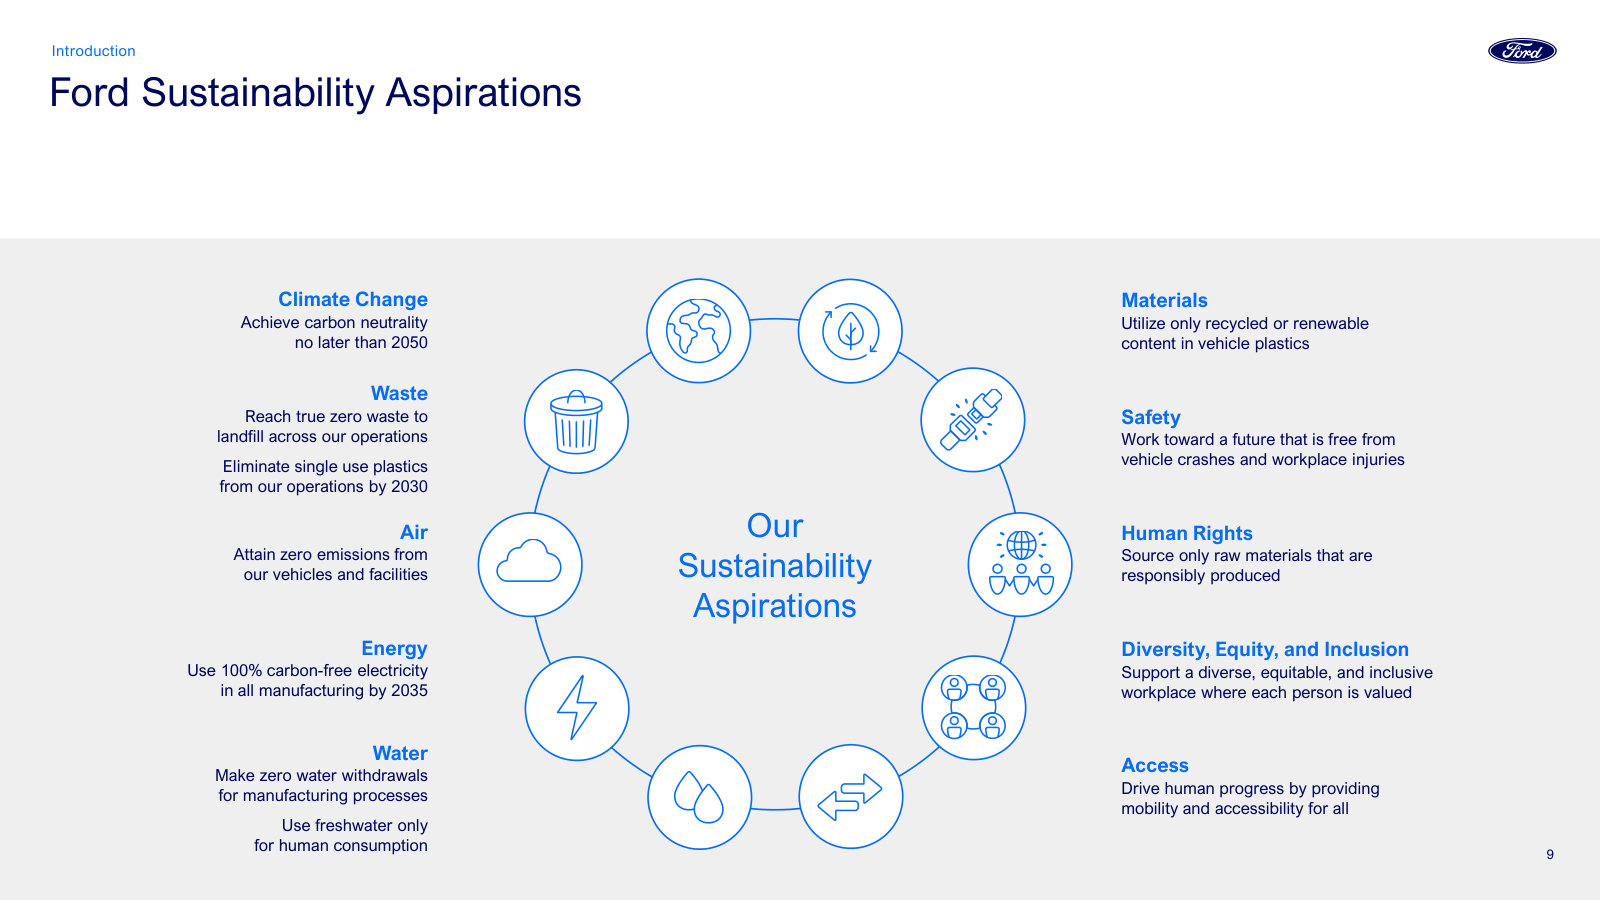
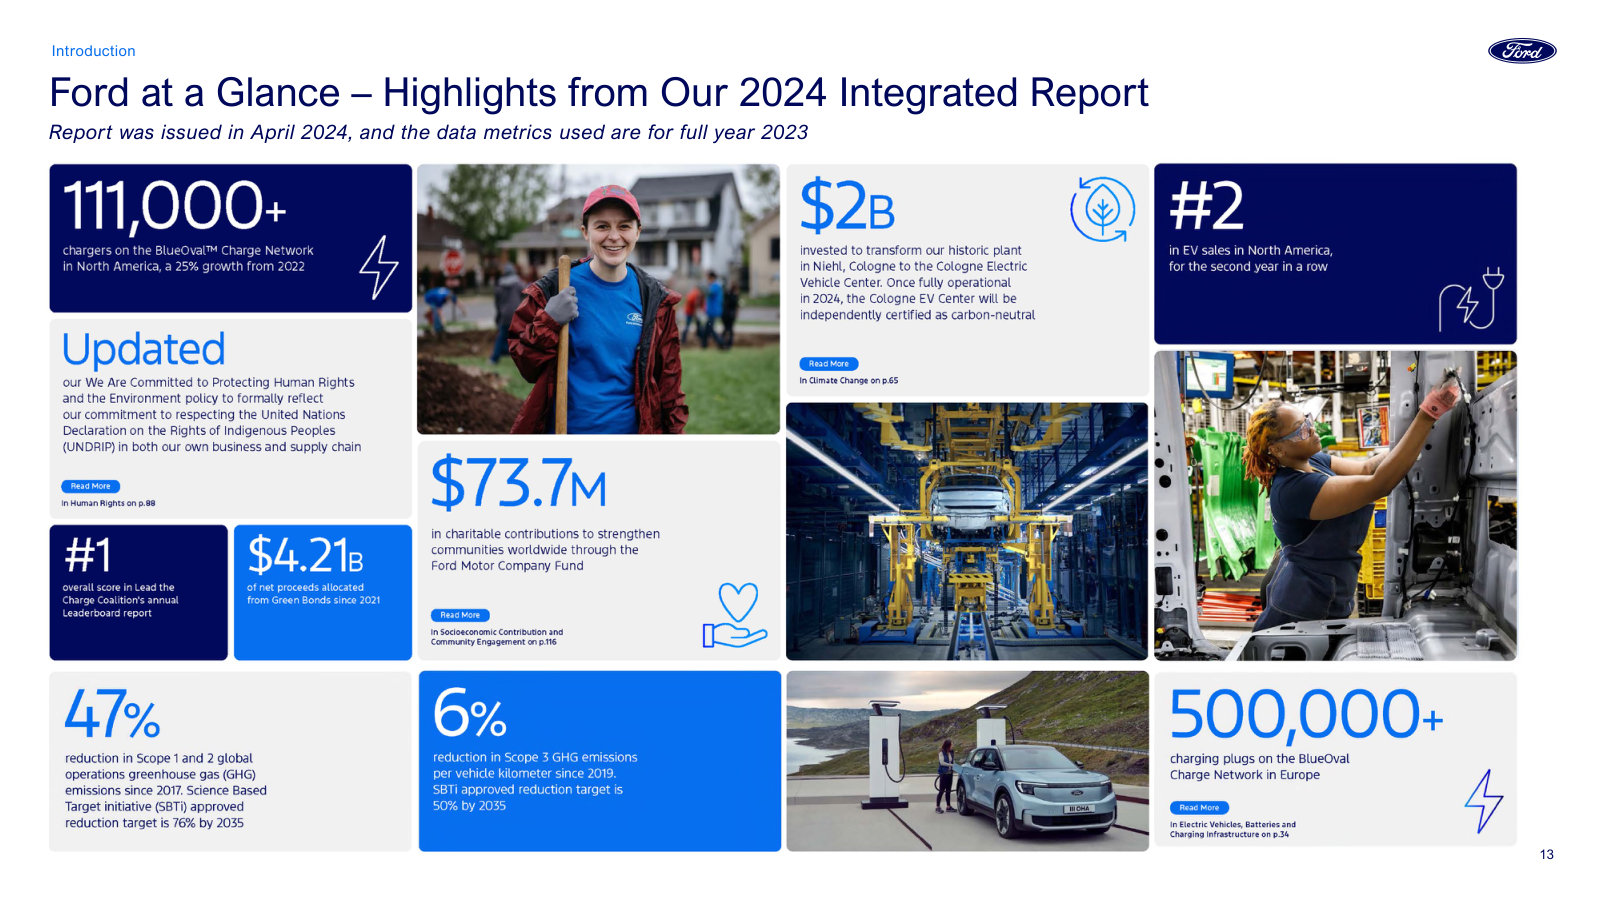
The fullest single statement of the Ford+ investment thesis and sustainability framing; note it predates the late-2025 EV strategy reset. · Open the full document →
More from management
Societe Generale Mobility Credit Conference — 2026 · 51 pages · Ford+ strategy, full-year 2025 results and the Ford Credit deep-dive bundled into one conference deck. · Open →
Q4 & Full Year 2025 Earnings Presentation — Q4 & FY 2025 · 37 pages · Full-year 2025 segment results, the initial 2026 guidance, and the $10.7B Model e impairment behind the EV reset. · Open →
Q3 2025 Fixed Income Investor Presentation — Q3 2025 · 45 pages · The Ford Credit and funding detail as of Q3 2025, before this year's EV writedowns. · Open →
Q1 2025 Fixed Income Presentation (Lloyds Bank Investor Forum) — Q1 2025 · 42 pages · An earlier fixed-income investor deck for a debt-focused audience. · Open →
Q4 & Full Year 2024 Earnings Presentation — Q4 & FY 2024 · 39 pages · The FY2024 results and original 2025 guidance — the prior-year baseline these decks are measured against. · Open →
Ford Motor Company's management answers for the business every quarter. These are the exchanges that explain it best — verbatim, from the call transcripts preserved in Sources. Each link opens the full transcript at that page in a new tab.
Q1 FY2026 Earnings Call — Q1 FY2026
Ford's newest strategy in management's words — parts-and-software as a high-margin annuity, the Ford Energy bet, and how the truck franchise stays defended. · Open the full transcript →
How mix, not volume, drives Ford Blue: off-road trims are 25% of volume and "relatively more profitable."
Andrew Frick (President, Ford Blue and Model e); James Farley (President and CEO): Yes, that is part of our strategy. It's a big piece of why our Blue business is doing well overall. […] And we actually grew our share in the off-road space, which accounts for 25% of our volume, but our share actually grew by 0.7 points, which was really important. That's because we're able to lean into multiple vehicles now, series like Tremor and Raptor, and really drive those mixes. So it is relatively more profitable, and it all plays back to our overall strategy of leaning into our profit pillars and winning with passion products. […] No boring products.
p. 6 · Read in context →
Q4 & Full-Year FY2025 Earnings Call — Q4 FY2025
Full-year framing — segment-by-segment economics, the EV strategy reset, and the aluminum-supply shock the business is absorbing. · Open the full transcript →
The four profit engines in numbers: Ford Pro's $6.8B EBIT, Model e's $4.8B loss, Blue's $3B, Ford Credit's $2.6B.
Sherry House (CFO): Now turning to segment highlights. Ford Pro once again demonstrated its importance and persistence as a key profit pillar for Ford by delivering more than $66 billion of revenue and EBIT of $6.8 billion with a double-digit margin. […] Paid software subscriptions grew by 30% last year. […] EBIT losses for the year improved to a $4.8 billion loss, reflecting fewer losses on Gen one products partially offset by increased investment in our Gen two products as we prepare for the launch of our UEV platform in 2027. […] Blue delivered $3 billion in EBIT as lower warranty, other cost improvements, and growth in software and physical services were more than offset by planned and unplanned lost production and adverse exchange. Ford Credit delivered full-year EBT of $2.6 billion and distributions of $1.7 billion. EBT was up 55% for the year, reflecting improved financing margin. Ford Credit continues to originate a high-quality book with U.S. retail and lease FICO scores exceeding 750.
p. 2 · Read in context →
Absorbing the Novelis aluminum-fire shock: a $2B 2025 hit, $1.5–2B of temporary supply costs, and a contingency plan.
Joseph Spak (Analyst); Sherry House (CFO); Kumar Galhotra (Chief Operating Officer): So, basically, we'd have nonrecurrence of the $2 billion from last year. Right? So that would start your 2026 better. And then we had planned on being able to make up about $1 billion of that. Now we think it's probably a half a billion to $1 billion. So that's how I said top line, 2.5 to three, but we have temporary costs. Those are going to be 1.5 to 2. So when you take that off, that gets you with the net positive $1 billion for the year. […] We have a contingency plan to secure sufficient supply for various scenarios no matter where we end up with the start date between May and September.
p. 6 · Read in context →
Q3 FY2024 Earnings Call — Q3 FY2024
The strategy reset — cutting EV capacity, leaning into hybrids and Ford Pro, and the discipline behind holding cash rather than buying back stock. · Open the full transcript →
The EV reset, stated plainly: volumes up 35% but revenue flat, capacity cut 35%, every EV to be profitable within 12 months.
Jim Farley (President and CEO): No doubt there's a global price war and it's fueled by overcapacity, a flood of new EV nameplates, and massive compliance pressure. In our home market in the US, no OEM is immune. Since Q1 of last year, EV volumes have grown 35%, while revenues in total are flat at $14 billion. That means the progress on volume has been fully offset by prices. We're expecting roughly 150 new EV nameplates to hit North America by the end of 2026. […] What we're doing about these market dynamics? Well, we're focused on cost. We've already reduced $1 billion in our EV costs this year. We remade our battery footprint. We trimmed our capacity by 35%, in line with where we think the market will be in a few years. […] We're shifting new launches, focusing on getting the products we do have in our EV portfolio profitable within the first 12 months, and we're deep into the design and engineering of our next-generation vehicles.
p. 1 · Read in context →
Why powertrain choice is a moat: a nearly 80% share of hybrid pickups, and #1 ICE, #2 EV, #3 hybrid in the US.
Jim Farley (President and CEO): Another strength is our diverse powertrain lineup. For example, in the US, the hybrid pickup sales at Ford have more than doubled in the past two years. We now have a nearly 80% market share of hybrid pickups. A lot of our competitors shunned hybrids and now they're scrambling, but it's going to take them years to catch up. Interestingly, in our home market, Ford is the #1 ICE brand, the #2 EV brand, and the #3 hybrid brand.
p. 2 · Read in context →
Q1 FY2023 Earnings Call — Q1 FY2023
The debut of the Ford Blue / Model e / Ford Pro structure — how each segment is meant to make money, in management's own words. · Open the full transcript →
The EV profit philosophy at its debut: "we are not going to price just to gain market share" — unlike the "pure EV players."
Jim Farley (President and CEO); Adam Jonas (Morgan Stanley): So, I would say the message from me as the CEO is that we are not going to price just to gain market share. We will always balance a healthy profit road map. In the first generation of products, it's pretty challenging because we didn't know what we didn't know four years ago when we designed them. But now we're two years into designing the second cycle. And in Capital Markets Day, we will take you through why we believe that 8% margin is totally realistic despite all the pricing pressure that we will absolutely get because everyone wants to grow. So I would say we're quite different than maybe some of the pure EV players that are pricing just for growth. We will always balance that because we want a profitable EV business, and we're pulling every lever we can in the first-gen products. The second gen is where we can really make hay.
p. 13 · Read in context →
Where Ford Pro's profit really comes from: small and medium businesses that have waited three to four years for trucks.
Jim Farley (President and CEO): On Pro, I just want to highlight a few things, John. There was a huge backorder of vehicle pent-up demand for small business in the U.S. and Europe that is still not even close to being satisfied. […] But most of the real profitable Pro business is small and medium-sized business, and they have been waiting literally three to four years for their Transit and Super Duties.
p. 18 · Read in context →
The clearest statement of the model: services are an annuity, and vehicles must hit 8% EBIT on their own.
John Murphy (Bank of America Merrill Lynch); Jim Farley (President and CEO): do you think in five years' time plus that you're going to be sort of selling the vehicles hardware and making all the money on the back end? I mean, how should we think about sort of the balance of how the money is earned on vehicles going forward? […] Well, that business model – I mean, outside of maybe Tesla, that business model is live and well at Ford right now in Pro. So, when I answer your question, please understand that we are operating that kind of business, where our after-sales and software is now large 30-plus percent attach rates. And I would say the answer is I am not giving any relief to my vehicle teams for software sales or any kind of margin advantage. They – those products have to get to 8% on their own. […] That's an annuity we want to create, and we do not want to commoditize our products. That is not our strategy. Maybe someone else's, but not ours.
p. 19 · Read in context →
More calls
Q3 FY2025 Earnings Call — Q3 FY2025 · 12 pages · Tariff mechanics laid out — the roughly $1B net receivable, the elimination of ~$2.5B in emissions-compliance costs, and Ford Credit's move into subprime F-150 lending. · Open →
Q2 FY2025 Earnings Call — Q2 FY2025 · 13 pages · Ford's first full quarter managing the 2025 tariff regime, with the cost-recovery and pricing playbook. · Open →
Q1 FY2025 Earnings Call — Q1 FY2025 · 10 pages · The quarter Ford suspended full-year guidance on tariff uncertainty — the clearest read on tariff exposure and mitigation levers. · Open →
Q4 & Full-Year FY2024 Earnings Call — Q4 FY2024 · 12 pages · Full-year 2024 results and the 2025 operating plan under John Lawler. · Open →
Q4 & Full-Year FY2023 Earnings Call — Q4 FY2023 · 43 pages · Full-year 2023 (the UAW-strike year) and the original Ford+ capital-returns and long-term margin framing. · Open →
Q3 FY2021 Earnings Call — Q3 FY2021 · 41 pages · Early in Farley's tenure — the original Ford+ turnaround thesis, before the Blue/Model e/Pro segment split. · Open →
Ford Motor Company's annual reports contain management's most considered account of the business. These are the sections, passages and visual pages worth opening in the originals preserved in Sources.
Ford Motor Company — FY2025 Annual Report (Form 10-K) — FY2025
The year Ford took an $8.2B GAAP loss on a $10.7B EV writedown while adjusted EBIT stayed positive — management's own account of the reset. · Open the full document →
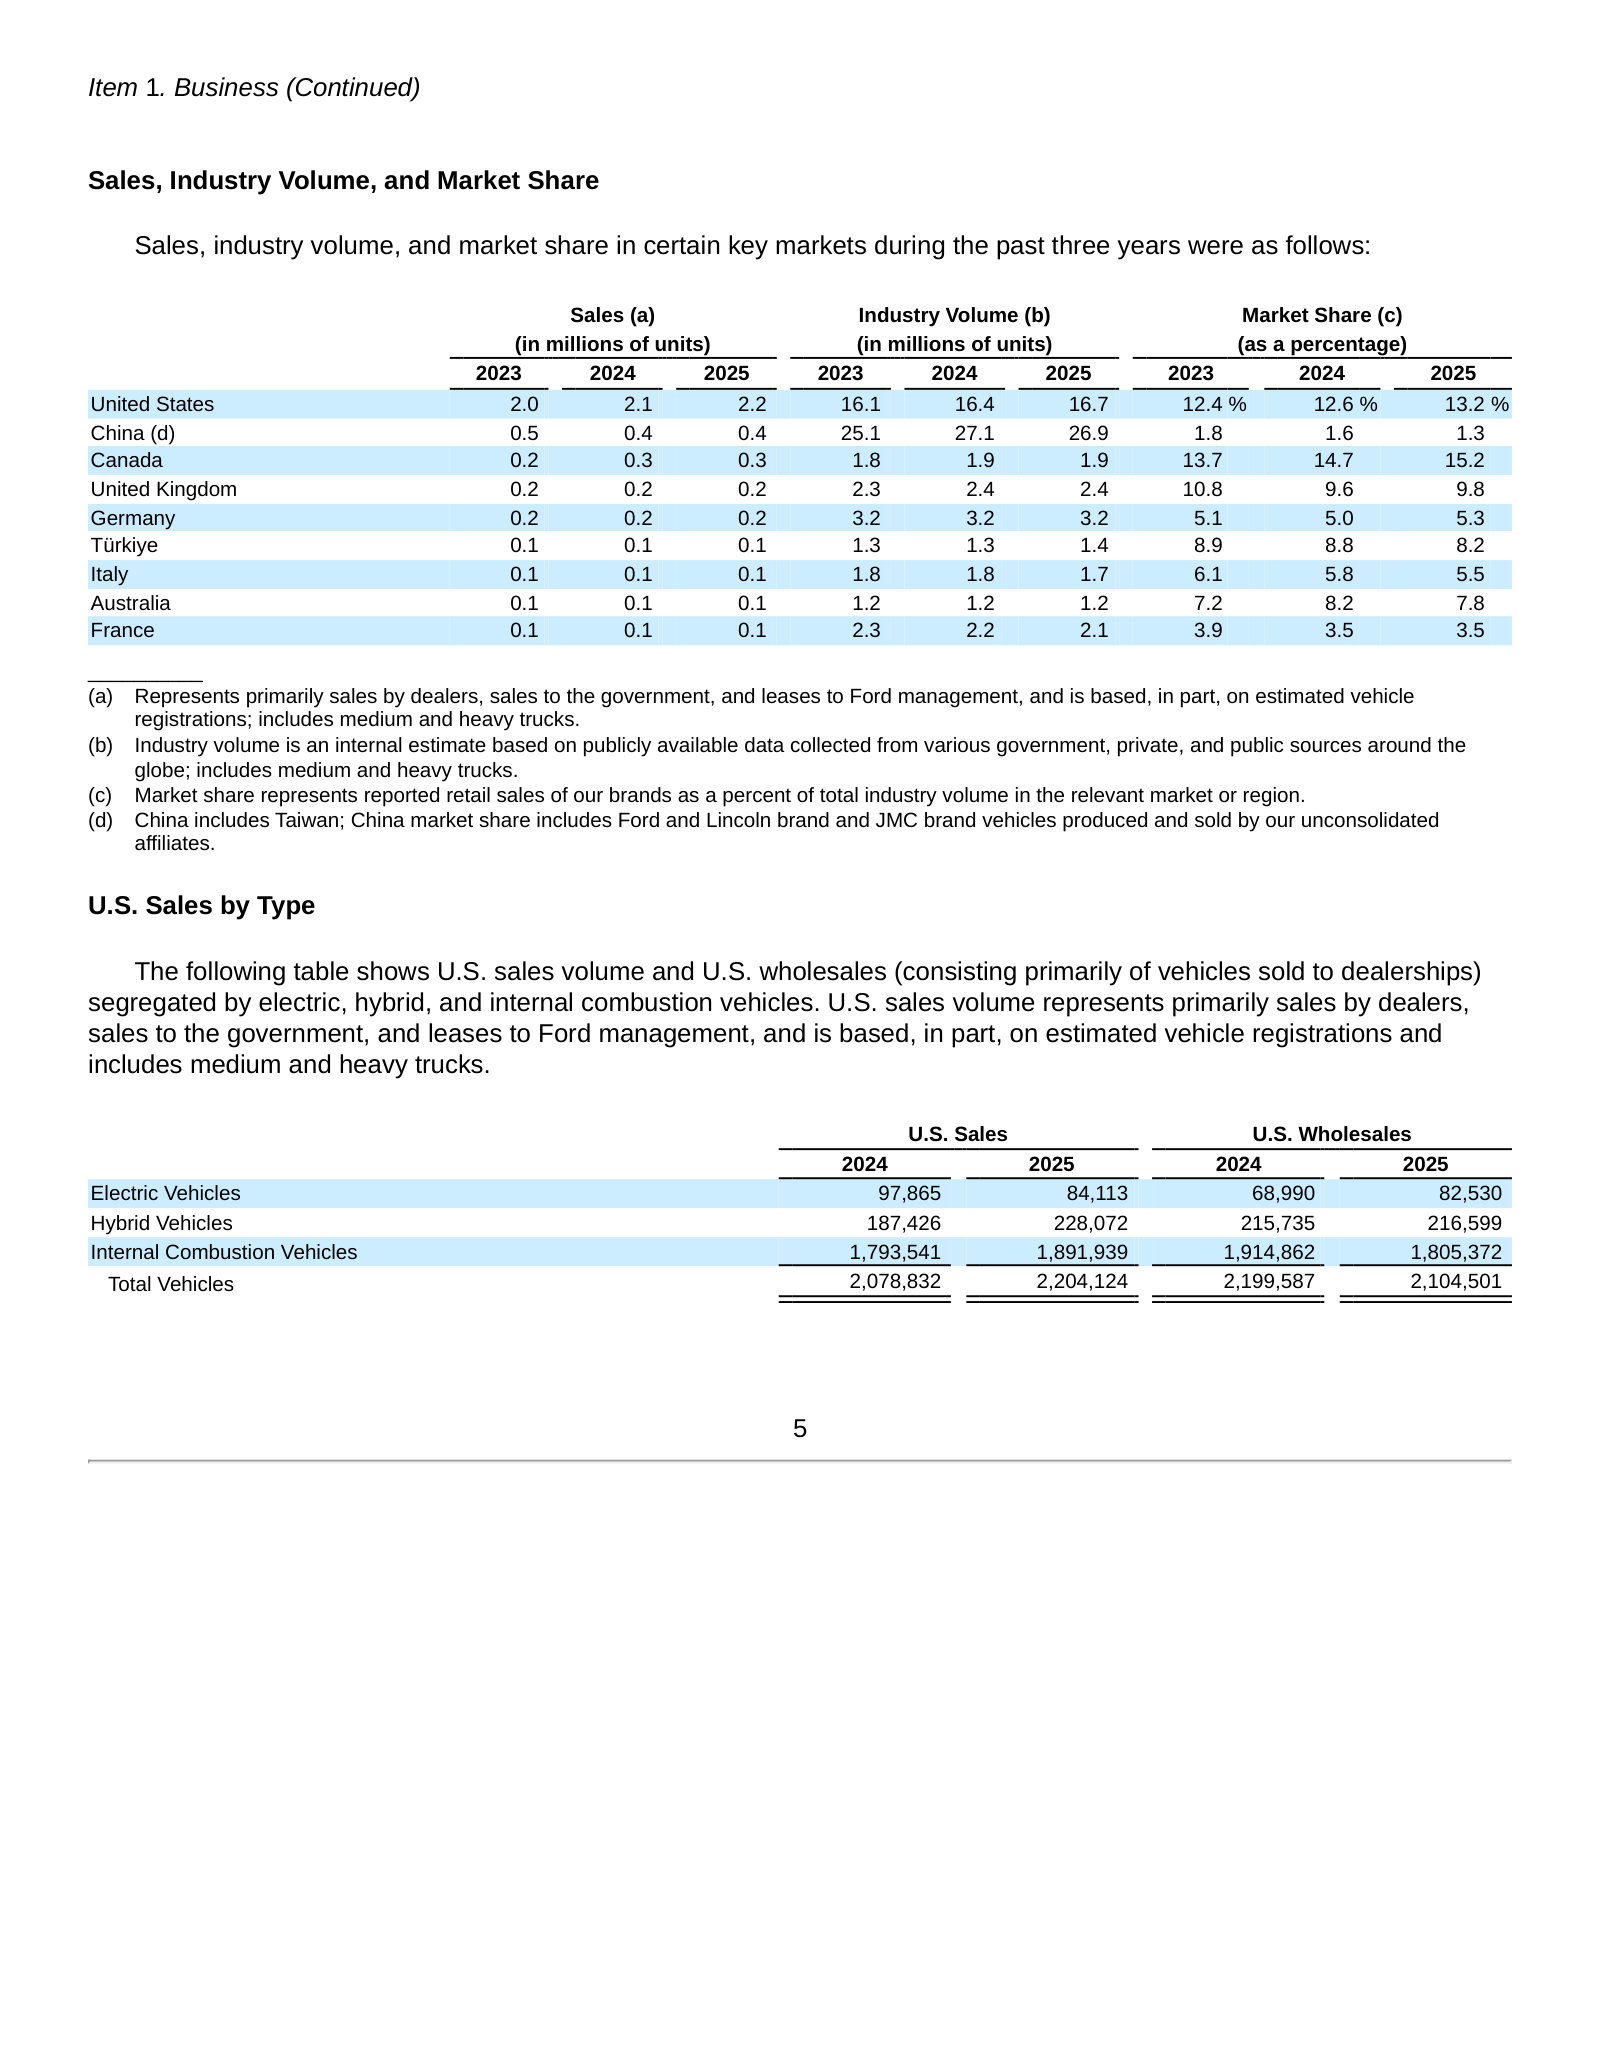
Item 1. Business — p. 5 · Read the full section →
Defines how Ford now organizes itself: ICE/hybrid (Ford Blue), EVs (Model e), commercial (Ford Pro), plus the Ford Credit finance arm.
Item 1A. Risk Factors — p. 30 · Read the full section →
The two risks most specific to Ford: profit concentration in large ICE trucks and SUVs, and EV demand running below plan.
Profit depends on selling large, profitable trucks and utilities in the U.S.
Ford’s results are dependent on sales of larger, more profitable vehicles, particularly in the United States. A shift in consumer preferences away from larger, more profitable vehicles with internal combustion engines (including trucks and utilities) to other vehicles in our portfolio that may be less profitable could result in an adverse effect on our financia condition or results of operations.
p. 50 · Read in context →
EV adoption has run below plan, forcing Ford to keep adjusting investment and production.
Although we are investing in our EV strategy, we anticipate that the EV market will continue to evolve. To date, we have observed lower-than-anticipated industrywide EV adoption rates due to changes in consumer sentiment, competitive dynamics, legal and policy changes, and significant developments in vehicle pricing dynamics, among other factors that we continue to monitor. This environment has led us, and may in the future lead us, to adjust our investments, spending, production, and product and future technology launches to better match the pace of EV adoption.
p. 48 · Read in context →
Item 7. MD&A — Key Trends and Economic Factors Affecting Ford and the Automotive Industry — p. 74 · Read the full section →
Management leads the MD&A with trade policy — the tariff regime is now the first-order variable for an automaker with global supply chains.
Tariffs framed as a material, ongoing disruption to the industry and to Ford.
Tariffs implemented to date in the United States and elsewhere have caused significant disruption, increased costs (both directly and indirectly), and uncertainty in the automotive industry, including for Ford, other OEMs, suppliers, and dealers, as well as customers.
p. 74 · Read in context →
Item 7. MD&A — Results of Operations – 2025 — p. 81 · Read the full section →
The story of the year: adjusted EBIT stayed positive, but special-item charges led by the Model e writedown drove a GAAP net loss.
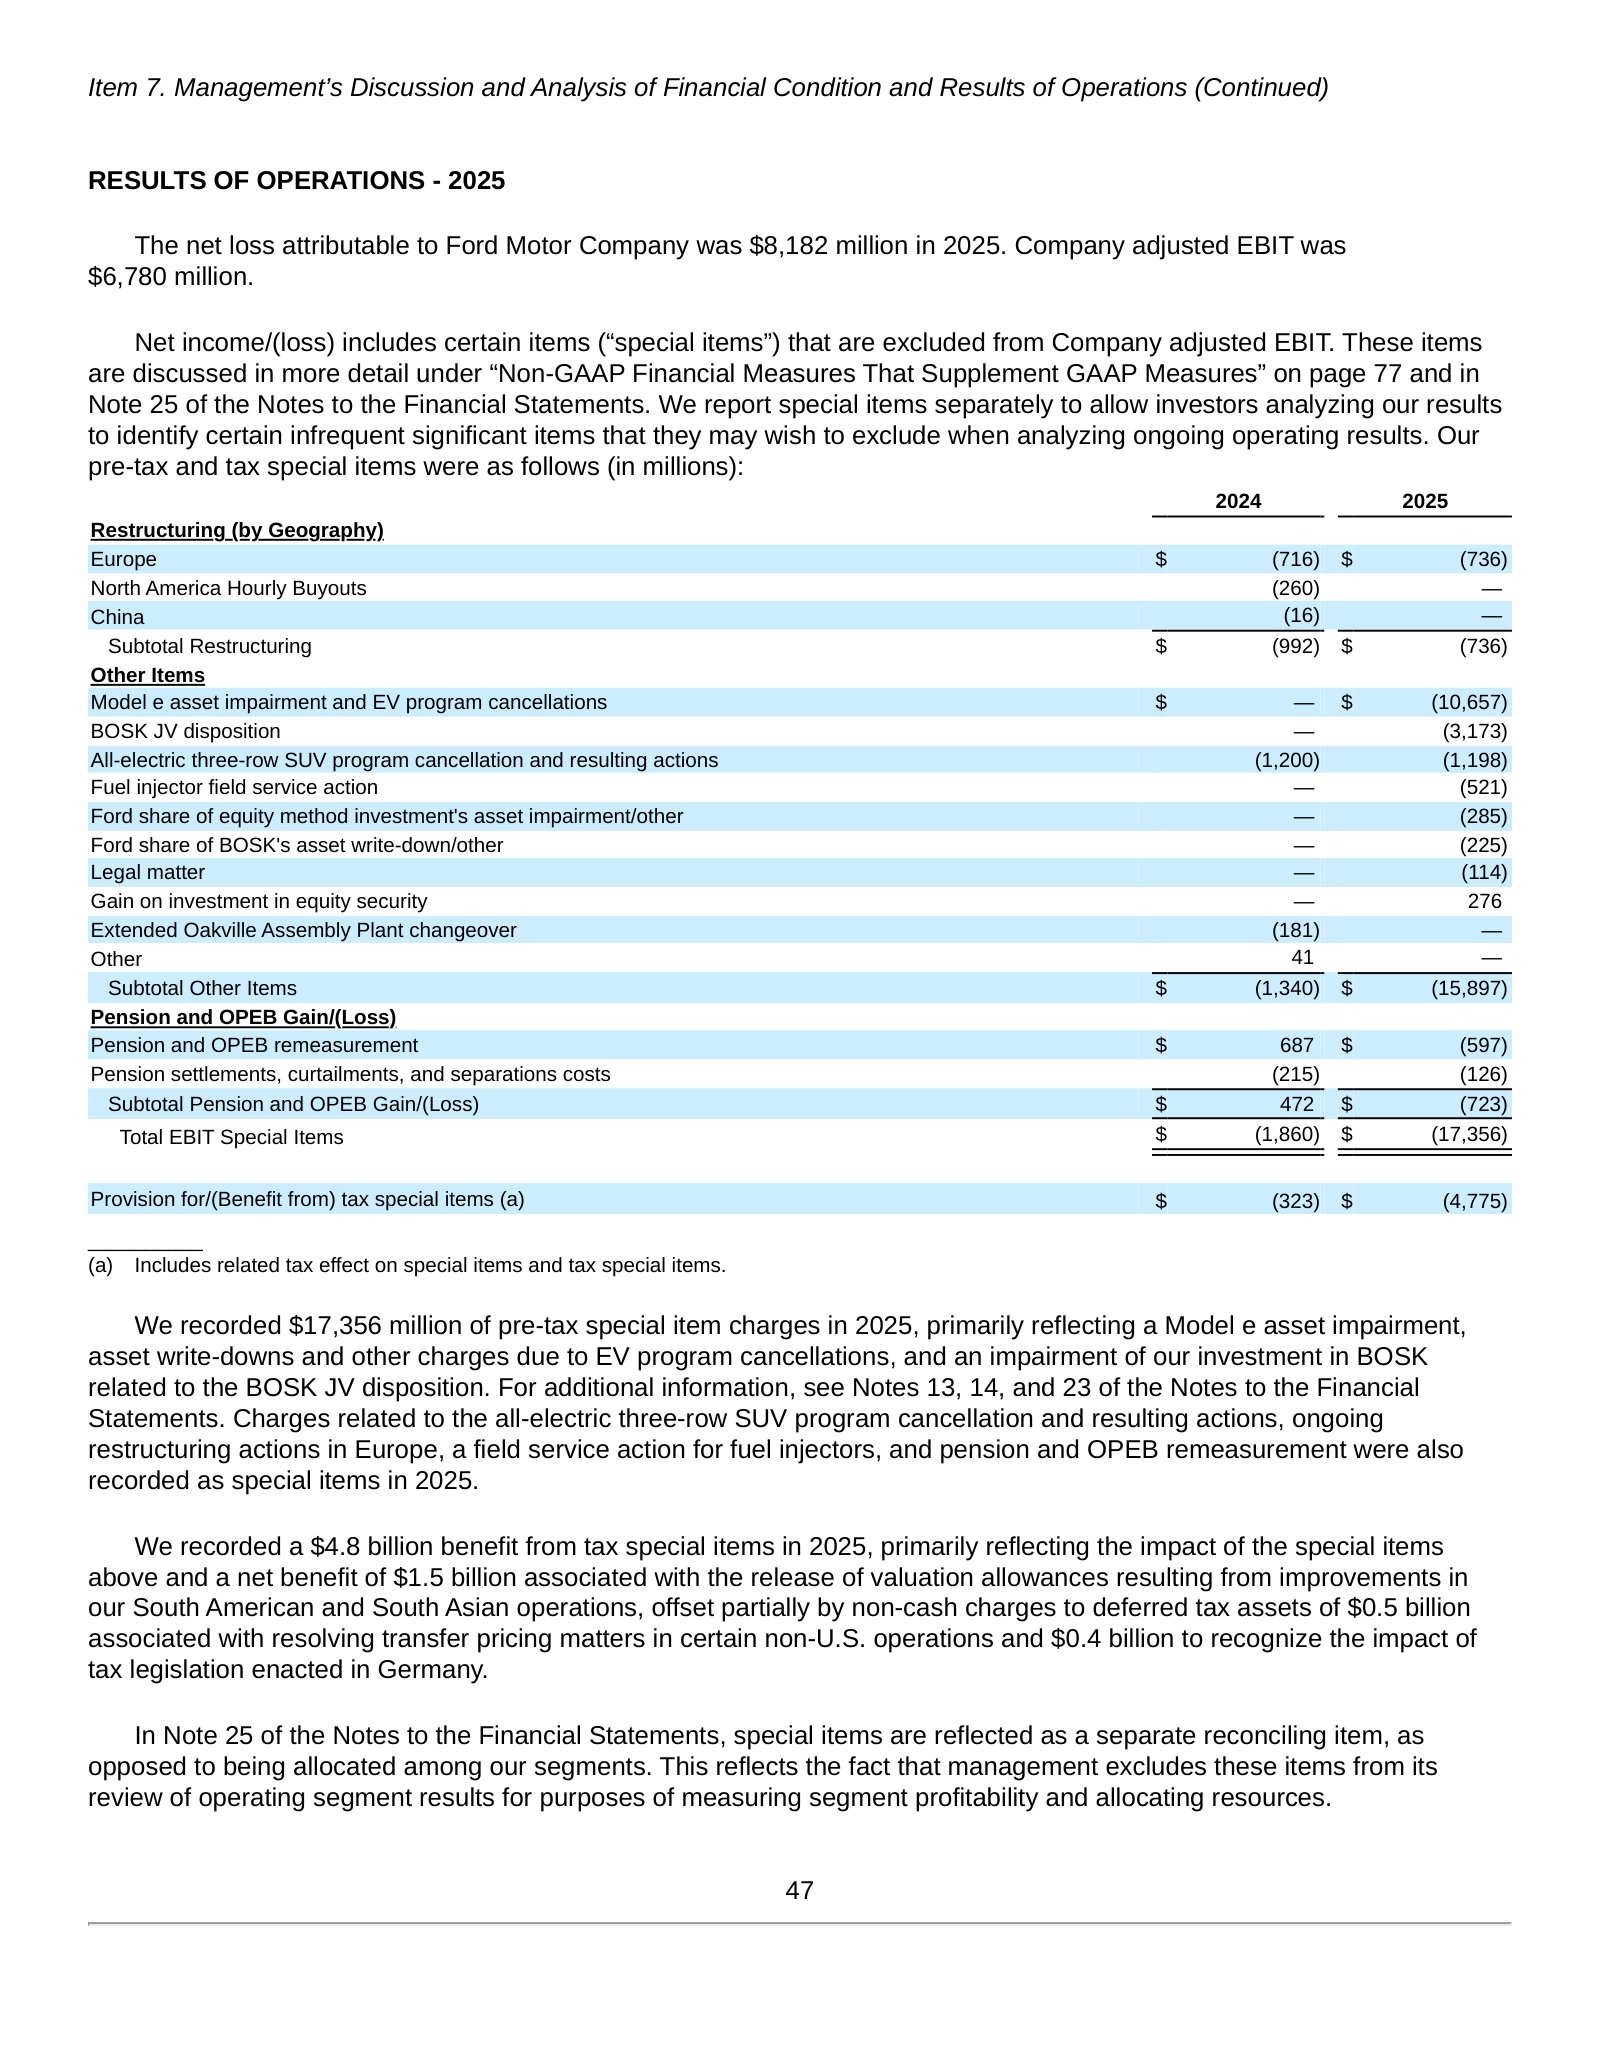
The GAAP-vs-adjusted gap: negative net margin, still-positive adjusted EBIT margin.
Net income/(loss) margin was negative 4.4% in 2025, down from 3.2% a year ago. Company adjusted EBIT margin was 3.6% in 2025, down from 5.5% a year ago.
p. 82 · Read in context →
Item 7. MD&A — Outlook — p. 112 · Read the full section →
The forward guidance and, just as important, the tariff and policy assumptions management explicitly excludes from it.
2026 guidance rests on stated assumptions and excludes unannounced tariff or policy changes.
We provided 2026 Company guidance in our earnings release furnished on Form 8-K dated February 10, 2026. The guidance is based on our expectations as of February 10, 2026, and assumes no material change to our current assumptions for inflation, logistics issues, production, or macroeconomic conditions. Moreover, our guidance has not factored in any new policy changes by the administration in the United States, including future or revised tariffs or related offsets, that have not been announced or tariffs or other policy changes that may be announced by other governments after the date hereof.
p. 112 · Read in context →
Critical Accounting Estimates — Warranties and Field Service Actions — p. 124 · Read the full section →
The accrual that translates recalls and field service actions into earnings — a defining, judgment-heavy cost line for a legacy automaker.
Warranty and recall costs are accrued at the time of sale, then re-estimated over time.
Separately, we also periodically perform field service actions related to safety recalls, emission recalls, and other product campaigns. Software updates are increasingly a component of vehicle service and may be performed during warranty coverage repairs, through field service actions, or through over-the-air updates. We accrue the estimated cost of both base warranty coverages and field service actions at the time of sale.
p. 124 · Read in context →
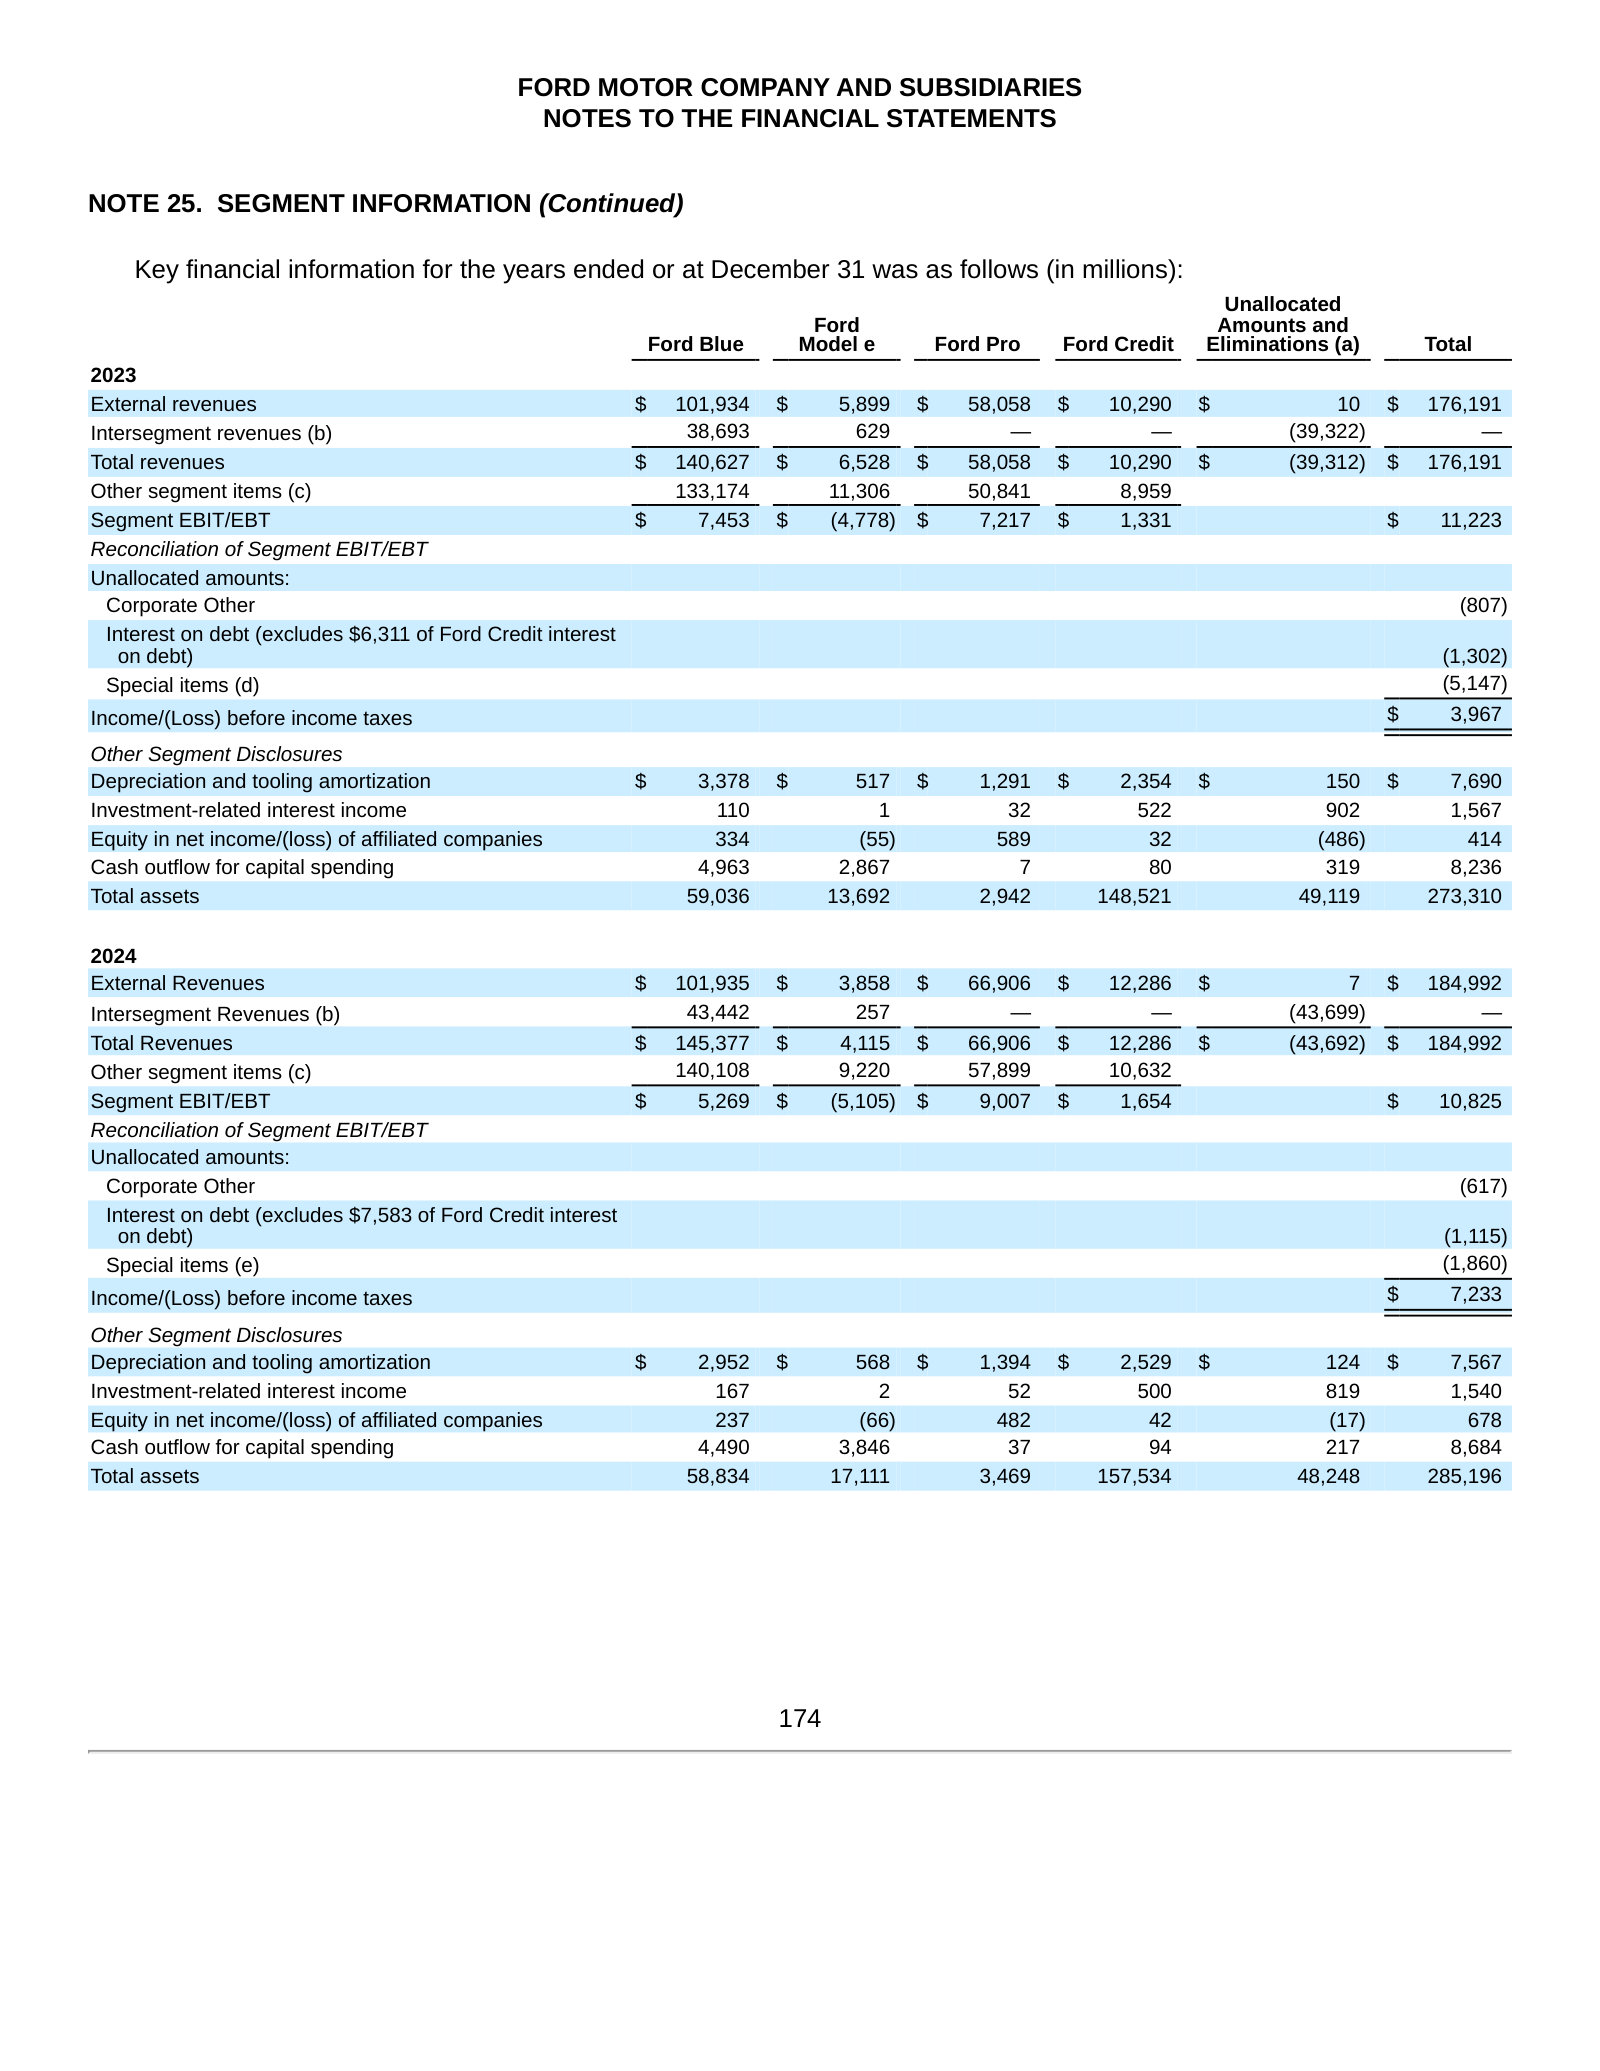
Note 25. Segment Information — p. 235 · Read the full section →
The audited segment financials behind the story — revenue and results split across Ford Blue, Model e, Ford Pro, and Ford Credit.
Ford Motor Company — FY2021 Annual Report (Form 10-K) — FY2021
Included for one contrast: the pre-Ford+ structure, before Ford split its car business into Ford Blue, Model e, and Ford Pro. · Open the full document →
Item 1. Business — Overview (pre-reorganization segments) — p. 5 · Read the full section →
In FY2021 the whole car business was one Automotive segment reported by region — the structure the FY2022 redefinition replaced.
One Automotive segment, organized by geography — later split into Ford Blue, Model e, and Ford Pro.
The Automotive segment primarily includes the sale of Ford and Lincoln vehicles, service parts, and accessories worldwide, together with the associated costs to develop, manufacture, distribute, and service the vehicles, parts, and accessories. This segment includes revenues and costs related to our electrification vehicle programs. The segment includes the following regional business units: North America, South America, Europe, China (including Taiwan), and the International Markets Group.
p. 6 · Read in context →
More annual reports
Ford Motor Company — FY2024 Annual Report (Form 10-K) — FY2024 · 233 pages · The last full year of net income ($5.9B) before the 2025 reset — the base case the FY2025 charges are measured against. · Open →
Ford Motor Company — FY2023 Annual Report (Form 10-K) — FY2023 · 232 pages · Second full year of the three-segment reporting, with Ford Pro emerging as the profit engine and Model e losses widening. · Open →
Ford Motor Company — FY2022 Annual Report (Form 10-K) — FY2022 · 228 pages · First 10-K under the Ford Blue / Ford Model e / Ford Pro structure — the segment redefinition in its debut year. · Open →
Source: S&P Capital IQ consensus via Xpressfeed · Generated 2026-08-01.
The consensus tape shows a low-margin, roughly $174bn-revenue business whose earnings estimates are drifting up faster than its top line: FY2027 normalized EPS is up 4.6% over 180 days against a 2% revenue revision. Analysts have under-forecast revenue for seven straight quarters and normalized EPS in seven of the last eight, so guidance reads conservative. Yet the street stays hold-heavy, 13 holds against 8 buy-side ratings, with target prices spanning $11 to $20. Coverage thins sharply beyond FY2028, and several EPS surprises are exaggerated by near-zero consensus bases.
FY2027 EPS estimates up 4.6% over 180 days, outrunning a 2% revenue lift
Currency: USD · Scale: money in millions, absolute · Point-in-time consensus; Δ90d is Now versus 90d.
| Metric | FY | 180d | 90d | 30d | Now | Δ90d |
|---|---|---|---|---|---|---|
| EPS (normalized) | FY2027 | $1.81 | $1.85 | $1.83 | $1.90 | +2.6% |
| EPS (normalized) | FY2028 | $2.28 | $2.09 | $2.08 | $2.15 | +2.9% |
| Revenue | FY2027 | $175.27bn | $177.16bn | $177.40bn | $178.83bn | +0.9% |
| Revenue | FY2028 | $185.28bn | $185.21bn | $184.90bn | $184.07bn | -0.6% |
Revenue beat seven straight quarters before a narrow Q2 FY2026 slip
Normalized EPS has cleared consensus in seven of the last eight prints, the exception a 33% Q4 FY2025 shortfall; note that several EPS surprises are magnified by near-zero consensus bases.
Current sequences by metric: Revenue: 1 consecutive miss; EPS (normalized): 2 consecutive beats.
Currency: USD · Scale: money in millions, absolute · Consensus is captured before each actual first became effective.
| Quarter | Metric | Consensus | Actual | Surprise | Outcome |
|---|---|---|---|---|---|
| Q2 FY2026 | Revenue | $45.47bn | $44.89bn | -1.3% | Miss |
| Q2 FY2026 | EPS (normalized) | $0.35 | $0.42 | +21.3% | Beat |
| Q1 FY2026 | Revenue | $38.60bn | $39.82bn | +3.2% | Beat |
| Q1 FY2026 | EPS (normalized) | $0.19 | $0.66 | +256.6% | Beat |
| Q4 FY2025 | Revenue | $41.78bn | $42.45bn | +1.6% | Beat |
| Q4 FY2025 | EPS (normalized) | $0.19 | $0.13 | -32.9% | Miss |
| Q3 FY2025 | Revenue | $43.86bn | $47.19bn | +7.6% | Beat |
| Q3 FY2025 | EPS (normalized) | $0.36 | $0.45 | +25.4% | Beat |
| Q2 FY2025 | Revenue | $43.93bn | $46.94bn | +6.9% | Beat |
| Q2 FY2025 | EPS (normalized) | $0.33 | $0.37 | +11.1% | Beat |
| Q1 FY2025 | Revenue | $35.79bn | $37.42bn | +4.6% | Beat |
| Q1 FY2025 | EPS (normalized) | $0.02 | $0.14 | +557.0% | Beat |
| Q4 FY2024 | Revenue | $42.83bn | $44.94bn | +4.9% | Beat |
| Q4 FY2024 | EPS (normalized) | $0.32 | $0.39 | +20.4% | Beat |
| Q3 FY2024 | Revenue | $41.95bn | $43.07bn | +2.7% | Beat |
| Q3 FY2024 | EPS (normalized) | $0.47 | $0.49 | +4.0% | Beat |
EBITDA and EPS growth outrun low-single-digit revenue gains through FY2028
Revenue is forecast to grow low-single-digits a year while EBITDA and normalized EPS climb faster, the signature of a margin-recovery story rather than a volume one.
Currency: USD · Scale: money in millions, absolute · YoY uses the prior fiscal year from the feed; analyst count and range use the first displayed period.
| Metric | FY2026E | FY2027E | FY2028E | YoY | Analysts | Low / high |
|---|---|---|---|---|---|---|
| Revenue | $175.43bn | $178.83bn | $184.07bn | +0.8% | 11 | $169.94bn / $181.73bn |
| EBITDA | $13.66bn | $14.39bn | $15.93bn | +13.6% | 9 | $10.58bn / $15.77bn |
| EPS (normalized) | $1.86 | $1.90 | $2.15 | +70.8% | 15 | $1.79 / $1.93 |
Analysts split widely on FY2027 EPS and FY2028 revenue
Currency: USD · Scale: money in millions, absolute · Spread/mean is absolute high-low divided by absolute mean.
| Metric | Period | Mean | Low–high | Spread/mean | Analysts |
|---|---|---|---|---|---|
| EPS (normalized) | FY2027E | $1.90 | $1.40–$2.15 | 39.6% | 22 |
| Revenue | FY2028E | $184.07bn | $168.05bn–$198.70bn | 16.7% | 7 |
| EPS (normalized) | FY2028E | $2.15 | $1.70–$2.59 | 41.4% | 14 |
Street snapshot
Currency: USD · Scale: money in millions, absolute · Analyst counts shown explicitly.
| Street view | Reading | Analysts |
|---|---|---|
| Recommendation mix | Buy 5, Outperform 3, Hold 13, Underperform 0, Sell 1 | 22 |
| Consensus score | 2.50 | 22 |
| Target price | mean $15.78; median $15.46; high $20.00; low $11.00 | 20 |
EPS surprise percentages distorted by near-zero quarterly consensus
Quarterly normalized-EPS consensus near breakeven (Q1 FY2025 at $0.02, Q1 FY2026 at $0.19) produces surprise readings above 250% that overstate the true beat; the steadier revenue surprises are the more reliable signal.
Visible Alpha broker models via S&P Xpressfeed · 13 brokers · 516 line items · freshest revision 2026-07-29.
Ford's broker models are a four-engine story: Ford Pro (commercial) is the steady profit driver, Ford Blue (ICE) steps up in FY-2026, Ford Credit contributes a stable profit, and Ford Model E (EV) loses money in every year of the forecast even as its deficit narrows. Operating diluted EPS is modeled to jump from $1.13 to $1.82 in FY-2026, then rise only modestly toward FY-2028. Revenue grinds higher on price and mix rather than unit volume, which stays roughly flat. Coverage is deep on the headline P&L but thins on the segment, cash-flow, and dividend lines.
Ford Pro is the modeled profit engine; Model E loses money every year through FY-2028
Ford Pro's operating profit rises every year and Ford Blue steps up sharply in FY-2026, while Model E stays deeply loss-making even as its deficit shrinks. Ford Credit is a steady contributor and Corporate Other a small persistent drag.
| Line | FY-2025A | FY-2026E | FY-2027E | FY-2028E | YoY | Brokers |
|---|---|---|---|---|---|---|
| Profit engines | — | — | — | — | — | — |
| Operating income/(loss) - Ford Pro - Operating | $6.86bn | $7.20bn | $7.72bn | $7.94bn | +5.0% | 10 |
| Operating income/(loss) - Ford Blue - Operating | $3.23bn | $5.28bn | $4.96bn | $5.23bn | +63.8% | 10 |
| Operating income/(loss) - Ford credit (Financial services) - Operating | $2.35bn | $2.72bn | $2.71bn | $2.76bn | +15.7% | 10 |
| EV drag | — | — | — | — | — | — |
| Operating income/(loss) - Ford Model E - Operating | $-4.94bn | $-4.09bn | $-3.75bn | $-2.98bn | +17.2% | 10 |
| Operating income/(loss) - Corporate Other - Operating | $-599.13m | $-625.00m | $-645.39m | $-656.67m | -4.3% | 10 |
Where brokers split: the depth of Model E's EV losses and near-term cash
The FY-2026 free-cash-flow range spans negative to positive territory, so the modeled cash path is contested even in direction.
| Line | Period | Median | Q1–Q3 | Min–max | Brokers |
|---|---|---|---|---|---|
| Operating income/(loss) - Ford Model E - Operating | FY-2028E | $-2.71bn | $-3.24bn–$-2.54bn | $-4.45bn–$-2.14bn | 7 |
| Free cash flow - Company excluding Ford Credit | FY-2026E | $345.30m | $-1.70bn–$2.82bn | $-3.57bn–$5.99bn | 7 |
| Operating income/(loss) - Ford Blue - Operating | FY-2028E | $5.23bn | $4.51bn–$6.03bn | $4.20bn–$6.12bn | 7 |
Ford Blue and Ford Pro carry the top line; Model E revenue dips in FY-2026 before recovering
Ford Blue and Ford Pro are the overwhelming majority of revenue; Model E is small, and its FY-2026 revenue dip reflects a modeled pullback in EV volume before a later recovery.
| Line | FY-2025A | FY-2026E | FY-2027E | FY-2028E | YoY | Brokers |
|---|---|---|---|---|---|---|
| Revenue - Ford Blue | $99.68bn | $106.53bn | $107.63bn | $109.43bn | +6.9% | 10 |
| Revenue - Ford Pro | $66.17bn | $67.15bn | $68.99bn | $70.48bn | +1.5% | 10 |
| Revenue - Ford Credit (Financial services) | $13.36bn | $13.68bn | $13.89bn | $14.19bn | +2.4% | 12 |
| Revenue - Ford Model E | $6.42bn | $4.85bn | $5.87bn | $8.64bn | -24.5% | 10 |
| Total revenue | $185.70bn | $192.65bn | $196.81bn | $200.27bn | +3.7% | 12 |
Modeled revenue growth is priced, not shipped — volume is flat, revenue per unit rises
Total deliveries barely move across the forecast; the revenue increase comes almost entirely from higher revenue per unit, with Ford Pro commanding the richest mix. Model E deliveries are cut for FY-2026 before re-accelerating.
| Line | FY-2025A | FY-2026E | FY-2027E | FY-2028E | YoY | Brokers |
|---|---|---|---|---|---|---|
| Volume | — | — | — | — | — | — |
| Total units sold(K#) | 4.39m Number | 4.24m Number | 4.35m Number | 4.48m Number | -3.6% | 9 |
| Units sold - Ford Model E(K#) | 167,495 Number | 137,443 Number | 159,204 Number | 215,479 Number | -17.9% | 9 |
| Price / mix | — | — | — | — | — | — |
| Rev/unit - Total($) | $39,167 | $42,119 | $41,981 | $42,222 | +7.5% | 9 |
| Rev/unit - Ford Pro($) | $44,068 | $46,654 | $46,313 | $46,378 | +5.9% | 9 |
| Rev/unit - Ford Blue($) | $36,495 | $40,021 | $39,885 | $39,918 | +9.7% | 9 |
Coverage thins on segment and cash-flow lines
The headline P&L carries up to 13 brokers, but segment operating income and units rest on 7-10 and free-cash-flow and dividend lines on just 3-7 brokers, so treat the segment splits and cash path as directional. Estimates were last revised in late July 2026.
Headline P&L consensus, momentum and beat/miss live in the CapIQ tab.
Source: S&P Capital IQ transcripts via Xpressfeed · latest indexed call 2026-07-28 · generated 2026-08-01.
Latest call digest
Ford Motor Company, Q2 2026 Earnings Call, Jul 28, 2026 · 2026-07-28T21:00:00
Q2 2026 — reported July 28, 2026. The digest of prepared remarks was consistently upbeat: management framed the quarter as "growing evidence that our strategy is working," with $48.3 billion in revenue (down 4% year-over-year) but $2.5 billion in adjusted EBIT, up 17% on strong mix and net pricing. Full-year adjusted EBIT guidance was raised and narrowed to $10–11 billion (a $1 billion midpoint raise) and free cash flow lifted to $6–7 billion. Jim Farley organized the story around three Ford+ pillars — core auto, software/physical services, and adjacencies led by Ford Energy — and leaned on quality (a #1 finish among mainstream brands in J.D. Power's 2026 Initial Quality Study), off-road/passion products (25% of U.S. sales in the quarter), the ~$30,000 UEV platform launching next year, and a target of 20 gigawatt-hours of Ford Energy capacity by late next year.
The Q&A reality was more guarded than the script. Beneath the raise sat a $1.3 billion net loss driven by a $3.6 billion special charge tied to the May disposition of the BlueOval SK battery joint venture. Segment results were uneven: Ford Blue EBIT of $1.1 billion (up 72%) against a Ford Pro EBIT of $1.7 billion (down 26% on Novelis-related disruption) and a still-loss-making Model e (−$919 million, though improving). Analysts pushed on why the raise wasn't larger, why the implied second-half run-rate steps down (management cited an extra ~$900 million of commodity cost and higher UEV/Ford Energy investment), the pace of Ford Energy customer contracting, and the durability of the warranty/recall improvement. On 2027, CFO Sherry House walked through puts and takes but declined to commit to a direction, calling it "too early to say." Cathy O'Callaghan's Ford Credit delivered EBT of $757 million, and the company reiterated its 8% EBIT-margin target for 2029. A new IR chief, Maria Ricciardone, hosted her first call.
Participant coverage from the latest call.
| Group | Participants | Count |
|---|---|---|
| Management | Operator; Maria Ricciardone — Chief Investor Relations Officer, Ford Motor Company; James Farley — President, CEO & Director, Ford Motor Company; Sherry House — Chief Financial Officer, Ford Motor Company; Andrew Frick — President of Ford Blue, Ford Model e & Lincoln, Ford Motor Company; Kumar Galhotra; Alicia S. Davis — President of Ford Pro, Ford Motor Company | 7 |
| Analysts | Andrew Percoco — Head of North America Autos and Shared Mobility Research & Equity Analyst, Morgan Stanley, Research Division; Alexander Perry — Vice President, Equity Research Analyst, BofA Securities, Research Division; Joseph Spak — Analyst, UBS Investment Bank, Research Division; Mark Delaney — Equity Analyst, Goldman Sachs Group, Inc., Research Division; Dan Levy — Senior Analyst, Barclays Bank PLC, Research Division; Gautam Narayan — Assistant Vice President, RBC Capital Markets, Research Division; Michael Ward — Managing Director, Citigroup Inc., Research Division; Itay Michaeli — Senior Analyst, TD Cowen, Research Division; Emmanuel Rosner — Managing Director of Research & Senior Research Analyst, Wolfe Research, LLC; Colin Langan — Executive Director & Senior Equity Analyst, Wells Fargo Securities, LLC, Research Division; Xin Yu — Research Analyst, Deutsche Bank AG, Research Division | 11 |
Curated latest-call exchanges; one row per analyst topic.
| Analyst | Firm | Topic | What changed in Q&A |
|---|---|---|---|
| Andrew Percoco | Morgan Stanley | Ford Energy customer contracting | Pressed on whether Ford is in direct offtake talks with hyperscalers and "what inning" contracting is in; Farley said the demand signal is strong and put it at roughly the third inning of selling out 2028's 20 GWh capacity, with a broadening customer base beyond utilities. |
| Joseph Spak | UBS | F-Series second-half volume recovery | Asked why the guide assumes a more measured volume recovery despite the Novelis ramp being on track; House attributed the change to mix rather than demand, noting F-Series sits at a lean ~45-day supply with wholesale upside. |
| Mark Delaney | Goldman Sachs | Tariffs and USMCA | Probed further tariff mitigation and USMCA direction; Farley framed a revised USMCA as an opportunity to level the field versus Japan and South Korea and declined to give specifics on tariff mitigation, calling it early days. |
| Dan Levy | Barclays | Quality award and warranty/recall cost path | Asked what the J.D. Power #1 finish means for future warranty and recall costs; Kumar Galhotra said recalls are down about 40% year-over-year and described a "virtuous cycle" from initial quality to lower warranty and recall costs, though recall savings lag. |
| Colin Langan | Wells Fargo | Second-half run-rate / implied slowdown | Questioned why the second half shouldn't be annualized given the Novelis recovery; House pointed to higher second-half commodity cost (two quarters versus one), accelerated UEV, Ford Energy and Oakville investment, and the non-repeat of the Q1 IEEPA benefit. |
| Emmanuel Rosner | Wolfe Research | 2027 EBIT direction | Asked whether 2026 improvements carry into higher 2027 EBIT; House laid out puts and takes (Novelis cost non-repeat, cost reductions, IEEPA non-repeat, launch and commodity costs) but concluded it is too early to say whether they net to higher EBIT. |
Theme tracker
Themes are curator-classified across supplied calls.
| Theme | Status | Quarters mentioned | Read-through |
|---|---|---|---|
| Ford Pro and high-margin software / physical services | persisted | Q3 2023, Q2 2025, Q3 2025, Q4 2025, Q1 2026, Q2 2026 | The most consistent through-line: Pro is positioned as the durable, less-cyclical profit pillar, with paid subscriptions and parts/service repeatedly cited (roughly 1.6 million paid subscriptions by Q2 2026) and a target of software and physical services reaching about 20% of Pro EBIT. Central to the stated path to an 8% margin by 2029. |
| Model e losses and the EV strategy reset | persisted | Q3 2023, Q2 2025, Q3 2025, Q4 2025, Q1 2026, Q2 2026 | A recurring theme that shifted in tone from aggressive scaling toward a smaller, affordable, capital-efficient bet. Management rationalized the role of pure EVs in December 2025, and now centers on the ~$30,000 UEV platform (2027 launch) and in-house electrical architecture, targeting Model e breakeven in 2029. |
| Warranty, quality and the cost gap | persisted | Q3 2023, Q2 2025, Q3 2025, Q4 2025, Q1 2026, Q2 2026 | A multi-year effort framed as the single biggest lever to close the peer cost gap. Coverage costs improved earlier; recall/FSA benefits lag. By 2026 management pointed to a #1 J.D. Power initial-quality finish and recalls down ~40%, funding roughly $1 billion a year in material and warranty savings. |
| Tariffs and trade policy | emerged | Q4 2024, Q1 2025, Q2 2025, Q3 2025, Q4 2025, Q1 2026, Q2 2026 | First flagged as a risk in late 2024, quantified at about a $2 billion net headwind in 2025, then partly offset by U.S.-content credits (a one-time IEEPA benefit of $1.3 billion booked in Q1 2026). By 2026 ongoing tariffs of about $1 billion are described as part of run-rate cost, with USMCA the next policy swing factor. |
| Novelis aluminum supply disruption | emerged | Q3 2025, Q4 2025, Q1 2026, Q2 2026 | A plant fire in late 2025 became a dominant operational topic: temporary aluminum-sourcing costs (guided at $1.5–2 billion), lost F-Series/Super Duty volume, and a promised net ~$1 billion year-over-year EBIT improvement weighted to the back half of 2026 as the hot mill restarts. |
| Ford Energy (battery energy storage) | emerged | Q4 2025, Q1 2026, Q2 2026 | A new adjacency launched around late 2025, reporting through Model e, built on U.S. LFP battery manufacturing. Management targets ~20 GWh of capacity by late next year, frames it as a short-payback strategic business, and cites early customer contracting (e.g., an EDF agreement). |
| Off-road and passion-product mix | persisted | Q2 2025, Q3 2025, Q4 2025, Q1 2026, Q2 2026 | Raptor, Bronco and Tremor/off-road trims are repeatedly cited as a margin engine, growing from roughly 20% toward 25% of U.S. sales mix, and reinforced by regulatory changes that let Ford lean into higher-margin, previously compliance-constrained trims. |
| "From America, For America" sales campaign | dropped | Q2 2025 | A tariff-era, U.S.-built marketing push emphasized in mid-2025 (a "second phase" was referenced on the Q2 2025 call, implying prior recurrence). It did not appear in the subsequent four calls read, consistent with the acute tariff-pricing moment normalizing into ordinary go-to-market discipline. |
Guidance ledger
Quotes, calls, and speakers are source-verified; outcomes are curator-classified.
| Verbatim guidance | Call | Speaker | Curator outcome | Outcome note |
|---|---|---|---|---|
| “We are also raising and narrowing our full year adjusted EBIT guidance to between $10 billion and $11 billion, a $1 billion raise at the midpoint.” | Ford Motor Company, Q2 2026 Earnings Call, Jul 28, 2026 · 2026-07-28T21:00:00 | James Farley | pending | Latest FY2026 EBIT guide; the 2026 fiscal year was not complete as of this call. |
| “An increase in adjusted free cash flow to $6 billion to $7 billion” | Ford Motor Company, Q2 2026 Earnings Call, Jul 28, 2026 · 2026-07-28T21:00:00 | Sherry House | pending | Raised from the prior $5–6 billion FY2026 free-cash-flow guide; full-year result not yet available. |
| “we're raising our full year adjusted EBIT guidance to between $8.5 billion and $10.5 billion.” | Ford Motor Company, Ford Motor Credit Company LLC, Q1 2026 Earnings Call, Apr 29, 2026 · 2026-04-29T21:00:00 | James Farley | pending | Raised from the Q4 2025 initial $8–10 billion FY2026 guide, and raised again to $10–11 billion at Q2 2026. |
| “we expect company adjusted EBIT of $8 billion to $10 billion, adjusted free cash flow of $5 billion to $6 billion and capital expenditures of $9.5 billion to $10.5 billion” | Ford Motor Company, Ford Motor Credit Company LLC, Q4 2025 Earnings Call, Feb 10, 2026 · 2026-02-10T22:00:00 | Sherry House | pending | Initial FY2026 guide; subsequently raised to $8.5–10.5 billion (Q1 2026) and $10–11 billion (Q2 2026). |
| “We expect losses of $4 billion to $4.5 billion for Ford Model e.” | Ford Motor Company, Ford Motor Credit Company LLC, Q4 2025 Earnings Call, Feb 10, 2026 · 2026-02-10T22:00:00 | Sherry House | pending | By Q2 2026 management expected the FY2026 Model e loss to improve to about $4 billion; full-year result pending. |
| “This brings our updated adjusted EBIT guidance for 2025 to between $6 billion to $6.5 billion with adjusted free cash flow of between $2 billion and $3 billion.” | Ford Motor Company, Ford Motor Credit Company LLC, Q3 2025 Earnings Call, Oct 23, 2025 · 2025-10-23T21:00:00 | Sherry House | kept | FY2025 came in at $6.8 billion adjusted EBIT (stated on the Q4 2025 call), modestly above this range, with full-year free cash flow of $3.5 billion, above the $2–3 billion guide. |
| “we expect company adjusted EBIT of $6.5 billion to $7.5 billion, adjusted free cash flow of $3.5 billion to $4.5 billion and capital expenditures of about $9 billion.” | Ford Motor Company, Ford Motor Credit Company LLC, Q2 2025 Earnings Call, Jul 30, 2025 · 2025-07-30T21:00:00 | Sherry House | kept | FY2025 adjusted EBIT of $6.8 billion landed within this range, even after a mid-year cut to $6–6.5 billion following the Novelis fire. |
Q&A pressure map
Question counts and firms are curator tallies; analyst coverage shown above.
| Topic | Questions | Firms | Pressure / response |
|---|---|---|---|
| Guidance bridge and second-half / 2027 EBIT cadence | 7 | Wolfe Research, Morgan Stanley, TD Cowen, Wells Fargo | The most persistent line of questioning across recent calls: why raises were modest, why the implied second-half run-rate steps down, and whether 2027 improves. Management repeatedly pointed to timing, mix, commodity cadence and launch investment rather than a change in underlying demand. |
| Novelis aluminum recovery — timing, cost and volume makeup | 6 | UBS, Wells Fargo, BNP Paribas, Barclays | Analysts pressed on the hot-mill restart date, the size and phasing of temporary costs, and how much lost F-Series/Super Duty volume would be recovered. Management gave a restart window and stressed contingency aluminum supply and a net ~$1 billion improvement. |
| Tariffs, USMCA and mitigation | 5 | Goldman Sachs, UBS, RBC Capital Markets, Barclays | Recurring focus on the net tariff figure, the IEEPA parts credit, and USMCA. Ford emphasized its U.S. manufacturing footprint as an advantage but stayed non-specific on mitigation details. |
| Model e / EV losses and capital efficiency | 4 | Barclays, Wolfe Research, RBC Capital Markets, Deutsche Bank | Questions centered on how EV losses trend as volumes are cut and how the new UEV investment differs from prior capital-inefficient EV spend. On the Q3 2025 call, asked how to think about EV losses into next year, Farley deferred to a post-Q4 update, calling them "very big decisions for the company" — a plain non-answer to the specific modeling question. |
| Warranty, quality and the peer cost gap | 4 | Barclays, Goldman Sachs | Analysts repeatedly asked when quality gains would show up materially in warranty and recall costs. Management distinguished coverage (improving) from recall/FSA costs (longer lag), and by 2026 cited recalls down ~40% and a #1 initial-quality finish. |
| Ford Energy — customers, contracting and capacity | 4 | Morgan Stanley, JPMorgan Chase | As the new adjacency scaled, analysts probed customer identity, contracting pace and whether to add capacity. Management characterized demand as strong and contracting as early ("third inning" of selling 2028 capacity) while withholding specifics. |
Language shifts
Only language evidence verified against the referenced component is shown.
| Observation | Verbatim evidence | Call ID | Component |
|---|---|---|---|
| Rising confidence: by Q2 2026 management moved from describing a turnaround-in-progress to asserting the strategy is proven and the company is structurally different. | “Ford is becoming a more profitable, more disciplined and generally a different company.” | 2008501281 | 2 |
| A new macro-risk caveat entered the guidance language in 2026, explicitly carving out Middle East conflict and a U.S. downturn from the outlook — vocabulary not present in the mid-2025 calls. | “Our guidance does not include the potential impacts of a sustained conflict in the Middle East or a significant downturn in the U.S. economy, which could have a material impact on industry demand.” | 1991429165 | 3 |
| The EV tone hardened from the mid-2025 "Model T moment" enthusiasm to explicit acknowledgment of adverse market reality and a strategic retreat to affordable volume. | “We dealt decisively with the reality of the market and shifted our focus of our EV business to a high-volume, affordable end of the market.” | 1979541969 | 2 |
| Quality commentary shifted from lagging-indicator caution to concrete, quantified improvement, signaling firmer confidence in the warranty thesis. | “the number of recalls is down very substantially from last year. It's down about 40%.” | 2008501281 | 29 |
Across twelve quarters the call history shows a cost-and-quality turnaround steadily converting into raised guidance and, in 2025, into numbers that met or modestly beat plan. The swing factors are external and operational — tariffs and the Novelis aluminum disruption — while the 2027-plus story increasingly rests on less-proven adjacencies (Ford Energy, the UEV platform) and a still-loss-making Model e. Notably, management has repeatedly declined to commit to a 2027 EBIT direction, which keeps the durability of the improvement the central open question for the investment debate.
Competitors describe Ford Motor Company's market in their own filings and calls. These verified passages and visual pages show where their strategies meet, using source documents preserved in Sources.
General Motors Company (GM)
Ford's closest head-to-head rival: the other Detroit full-line automaker, fighting Ford in the same three profit pools — full-size pickups (Silverado/Sierra vs F-Series), commercial fleet (vs Ford Pro), and EVs. GM's own calls frame these as direct share battles against its 'closest competitor.'
GM's stated position in the U.S. full-size pickup segment — the profit core Ford's F-Series also anchors. GM claims 42%+ share, 'more than 10 percentage points above our closest competitor,' the head-to-head framing that puts Ford on the other side of the line.
Mary Barra, Chair and Chief Executive Officer: our share of the U.S. full-size pickup market stands at more than 42% through the first half of the year, which is more than 10 percentage points above our closest competitor, and we grew share year-over-year in both the second quarter and the first half.
p. 1 · Read in context →
GM's compact scorecard across the three fronts it shares with Ford — full-size pickups (42%), fleet/commercial (#1), and EVs (#2, U.S. EV share rising to 13%) — GM's own stated read on where it stands in each.
Mary Barra, Chair and Chief Executive Officer: We also continue to lead in full-size pickup sales and share with 42% of the U.S. market. In addition, we were #1 in fleet, including commercial deliveries, and we were #2 in EVs. As we exited the quarter, our EV market share in the U.S. was 13% up from about 10% in December 2025, which underscores the appeal of our portfolio as the segment stabilizes.
p. 1 · Read in context →
GM's 10-K risk factor concedes its profit is concentrated in full-size ICE SUVs and pickups — the identical high-margin franchise Ford leans on — underlining that the two Detroit makers depend on the same segment for earnings.
we currently recognize the highest profit margins on our full-size ICE SUVs and full-size ICE pickup trucks. As a result, our success is dependent upon our ability to sell higher margin vehicles in sufficient volumes.
p. 26 · Read in context →
Stellantis N.V. (STLA)
Ford's most direct pickup-and-commercial rival by product: Ram 1500/HD square off against F-150/Super Duty, Ram ProMaster against Ford Transit, and Stellantis' Pro One commercial arm against Ford Pro. Stellantis names Ford Motor Company directly in its filings and benchmarks the U.S. market against it.
Stellantis' CEO details its commercial-vehicle position region by region — leadership in Europe (28%) and South America (31%) but only a 12% share in North America, the market where Ford Pro and Transit dominate. He also flags the Ram 1500's return to the lineup.
Antonio Filosa, Chief Executive Officer: Our great commercial vehicle products represent roughly 30% of our revenues in aggregate across the regions. In Europe, where we are number one in commercial vehicles with a solid 28% share […] In South America, we are also number one in commercial vehicle with a 31% share […] In North America, we have a 12% share, we have returned the Ram 1500 to the lineup with more product actions to come.
p. 4 · Read in context →
Stellantis' pickup and light-commercial portfolio maps onto Ford's franchise vehicle-for-vehicle — Ram 1500/2500/3500 against F-150/Super Duty, Ram ProMaster against Transit — and its all-electric Ram 1500 REV targets the same buyers as the F-150 Lightning.
We sell light duty and heavy duty pickup trucks such as the Ram 1500, Ram 2500/3500, Fiat Strada, Peugeot Landtrek, Jeep Gladiator, and chassis cabs such as the Ram 3500/4500/5500. Our LCVs include vans such as the Fiat Professional Doblò, Peugeot Partner, Citroën Berlingo, Opel/Vauxhall Combo and Ram ProMaster. […] The all-new, all-electric Ram 1500 REV light duty pickup will be built on the STLA Frame and is expected to launch in 2026.
p. 17 · Read in context →
Tesla, Inc. (TSLA)
The EV benchmark Ford's Model e segment is measured against, and the pricing/cost frontier it must chase. Tesla's Cybertruck contests the pickup segment, its Supercharger network is now the charging standard Ford's EVs plug into (NACS), and its filings cast 'established' automakers like Ford as the incumbents it is displacing.
Tesla's own segment map: Cybertruck against pickups (Ford's F-Series franchise) and Model 3/Y against mainstream sedans and SUVs — with 'internal combustion vehicles from more established automobile manufacturers,' Ford's category, named as the competition.
Cybertruck competes with other pickup trucks, Model S and Model X compete primarily with premium sedans and premium SUVs and Model 3 and Model Y compete with small to medium-sized sedans and compact SUVs, all of which are extremely competitive markets. Competing products typically include internal combustion vehicles from more established automobile manufacturers; however, many established and new automobile manufacturers have entered or have announced plans to enter the market for electric and other alternative fuel vehicles.
p. 20 · Read in context →
Tesla notes that all major automakers have adopted its North American Charging Standard — the structural asymmetry by which Ford's EV owners now charge on a network Tesla owns and operates.
We offer Supercharger access to non-Tesla vehicles in support of our mission, with all major automakers announcing their adoption of the North American Charging Standard (NACS) in certain markets.
p. 11 · Read in context →
Toyota Motor Corporation (TM)
The world's largest automaker and Ford's biggest global volume rival, competing directly in U.S. trucks and SUVs (Tacoma, RAV4, Highlander) and mainstream vehicles. Toyota's hybrid-led 'multi-pathway' strategy is the explicit counterweight to Ford's more concentrated EV bet.
Toyota's full-year scale and powertrain mix as it states them: ~9.6 million consolidated units and electrified sales above 5 million 'driven by HEVs that were well received in regions such as North America' — the hybrid-heavy mix that contrasts with Ford's EV-forward push.
Azuma, Accounting Group Chief Officer: Consolidated vehicle sales for this fiscal year reached 9 million 595 thousand units, or 102.5% year-on-year. […] Sales of electrified vehicles exceeded 5 million units for the first time, primarily driven by HEVs that were well received in regions such as North America and China, while PHEVs and BEVs also posted volume growth.
p. 5 · Read in context →
Toyota's own description of North America — and the U.S. specifically — as one of its most significant markets, the shared home turf where its trucks and SUVs compete with Ford's.
The North American region is one of Toyota’s most significant markets. The United States, in particular, is the largest market in the North American region, accounting for 86% of Toyota’s retail sales in the region.
p. 23 · Read in context →
Toyota frames battery-electric vehicles as 'just one pillar' of a multi-pathway strategy spanning hybrids, carbon-neutral fuels and hydrogen — the deliberately hedged electrification stance that sits opposite Ford's larger, more concentrated EV commitment.
BEVs are just one pillar of Toyota’s multi-pathway strategy for becoming carbon neutral. We are working with our partners on the development of carbon-neutral fuels such as biofuels and synthetic fuels […] We also see great potential in hydrogen.
p. 18 · Read in context →
Honda Motor Co., Ltd. (HMC)
A full-line Japanese rival competing with Ford across U.S. light vehicles, crossovers, hybrids and the EV transition, and retooling its established North American plants for EV production. Honda faces the same electrification-cost and tariff pressures now weighing on Ford's earnings.
Honda cuts its FY2026 global automobile forecast to 3.34 million units, citing North American demand and a semiconductor shortage — a read on the same U.S. market softness and supply constraints Ford contends with.
Noriya Kaihara, Director, Executive Vice President and Representative Executive Officer: For automobiles, in addition to lower sales volume mainly in China and ASEAN, declines due to semiconductor shortage have been taken into consideration for North America. We are revising down from 3.62 million to 3.34 million units.
p. 9 · Read in context →
Honda quantifies the twin drags on its profit — a JPY 223.7 billion EV-related one-time expense and a JPY 164.3 billion tariff hit — the electrification and tariff pressures that also run through Ford's results.
Eiji Fujimura, Director and Managing Executive Officer: Currency effect resulted in a negative impact of JPY 116.2 billion. EV-related one-time expense led to a negative impact of JPY 223.7 billion, and impact from tariffs led to a profit decline of JPY 164.3 billion.
p. 10 · Read in context →
Honda designates its three existing Ohio plants as central locations for EV production — a U.S. industrial footprint being converted for electric vehicles alongside Ford's own domestic EV build-out.
In North America, Honda has identified its three existing plants in Ohio (Marysville and East Liberty, which produce automobiles, and the Anna Engine Plant, which manufactures automobile powertrains) as central locations for EV production. While utilizing these existing facilities, we are constructing efficient and highly flexible EV production lines.
p. 37 · Read in context →
More peer documents
Tesla Q1 FY2026 call — real-price affordability + Giga Berlin output — 11 pages · CFO Taneja argues Model 3's real starting price is now below its 2015 launch in inflation-adjusted terms, with Giga Berlin at record output — the EV price frontier Ford's Model e must reach. · Open →
Stellantis Q2 FY2026 call — Ram pickup share clawback — 30 pages · Ram up 12% YoY and the Ram 1500 crossing 20%+ full-size-pickup segment share after the HEMI V8 relaunch — Stellantis regaining pickup ground in the F-150's core segment. (Note: some pages of this transcript carry a cookie-banner text artifact; page 7 is clean.) · Open →
Fit
Does not fit the framework (P1 not met); contested: X2
Ford clears both universe screens — US-listed on the NYSE, a ~$58.4 billion market cap — but the year-10 durability gate (P1) resolves not_met on unanimous jury votes, and that gate alone forces the outcome. The auto-OEM exclusion (X1) is also a hit. Confidence is low: the name-mask probe flipped one criterion (X2, the promotion-pattern exclusion), and X2 is contested across the jury — a name-mask divergence flag that caps confidence and carries a prior_driven_risk mark. Nothing here was undetermined at the cannot-determine level.
Market Cap ($B)
Price / Sales
Adj FCF Yield (3-yr avg)
Trial p(temporary)
Sources: market cap and price/sales derived from FY2025 revenue and the 2026-07-31 close (fit_features.market_cap); adjusted-FCF yield derived from Ford's disclosed Company adjusted FCF less stock compensation [1]; trial probability from the adversarial diagnosis trial.
Universe and exclusions
Universe — both screens clear. Ford is US-listed common stock on the New York Stock Exchange (ticker F), a Delaware corporation, not an ADR and not Chinese-domiciled — U1 passes [2]. Market capitalization is about $58.4 billion (3,979M shares × the $14.68 close on 2026-07-31), roughly 5.8× the $10 billion floor — U2 passes. The counter-fact sits in the same line: the stock traded as low as $8.69 in April 2025, but even at that trough (~$34.6B) the floor still cleared.
Exclusion X1 — Ford is a car company, and that is the framework's single named industry exclusion. This is not a business in decline: revenue rose to a record $187.3 billion in 2025 with no consecutive-year declines, and Ford Pro earns a 10.3% segment margin [3]. It is exactly the profile the exclusion guards against — an auto OEM that screens cheap on cash-flow yield in an intensely competitive market with installed capacity that generally exceeds demand [4] [5]. The exclusion is categorical, not conditional on decline. X1 = met (hit).
X3 (structural decline), X4 (consensus-saturated darling), S1 (China dependence): checked and clean. Consolidated revenue rose from $151.8B (2016) to $187.3B (2025) with zero consecutive high-single-digit decline years, so the X3 disqualifier flag is off. At ~0.31× sales with a GAAP loss and skeptical coverage, Ford is the opposite of a high-multiple darling, so X4 does not bind. China is a minor, shrinking exposure — 1.3% market share, mostly equity-method JVs whose revenue is excluded from the top line — recorded as a sensitivity flag (S1), not material dependence; the counter-fact is that Ford still took a $3,173M loss disposing of its BOSK China JV in 2025 [6].
Pattern match
Ford fits none of the framework's four recognition setups. It is not a large bank at the bottom of a credit cycle; it is not a high-dividend / high-FCF-yield business whose case turns only on the payout holding — the ~4.1% dividend is covered at mid-cycle but was fully suspended in 2020, so it is demonstrably first to be cut in stress; it is not a healthcare/insurance forecasting error with a regulatory repricing mechanism; and it is not a quality tech monopoly on a fear dip, because Ford has no monopoly or duopoly structure to reprice against. The nearest surface resemblance is a cyclical near a low, but two facts break it: the named industry exclusion (X1) applies, and there is no live dislocation to enter — the 2024-25 drawdown has round-tripped and the stock trades 28.8% above its pre-fall peak (see the Dislocation tab).
The pillar ledger
Source: ruchir/fit_tally.json per-criterion verdicts; arithmetic from the surviving claims cited in each treatment below.
Year-10 gate (P1) — not_met, unanimous
The gate asks whether year-10 revenue and adjusted free cash flow will be higher than today with very high conviction, and it is binary by construction: genuine doubt resolves to not_met. All four jurors voted not_met (probability 0.45, spread 0.04). None of the framework's conviction sources apply. Ford is a price-taker at 13.2% US share in a market with installed capacity that generally exceeds demand [7] [8]; capital intensity has failed to deter entry, with Chinese electrified-vehicle producers exporting into Ford's markets [9]; the Model e segment carrying the technology transition lost about $17.6B pretax over 2021-2025; and Company adjusted FCF nearly halved to $3.5B in 2025 [10]. The strongest surviving counter-fact: Ford Pro generated $66,286M of revenue and $6,843M of EBIT (10.3% margin) on sticky fleet/parts/software relationships, total revenue is at a record, and adjusted FCF is positive and self-funding even while absorbing Model e losses [11]. That is real, but it does not lift the read to very-high conviction on higher year-10 cash flow. Full treatment: Durability.
Consistency (P2) — not_met
The framework wants a stable rolling 5-year average of adjusted FCF; occasional trough years are fine for a genuine cyclical. Ford's disclosed Company adjusted FCF fell $6.8B → $6.7B → $3.5B across 2023-2025, and conversion to revenue slid from 3.9% to 1.9% while revenue rose every year — the automaker value-trap signature [12]. The counter-fact: adjusted FCF stayed positive through the Model e loss build, and GAAP operating cash flow reached $21.3B in 2025. The deterministic fit_features.fcf_stability is not_computable (the structured feed lacked a capex line), so this was assessed from Ford's own filed reconciliation. Full treatment: Yield.
Dislocation and yield (P3a–P3d) — event and capitulation present, yield and setup absent
A dated trigger existed — the April 2025 US auto-tariff shock, with Ford suspending 2025 guidance on 5 May 2025 [13] — and volume spiked 3.05× the trailing median, so P3a and P3b are met. But the fear has fully drained: the drawdown was −23.8% (peak $11.40 on 2024-11-25 to trough $8.69 on 2025-04-08) and the stock now sits 28.8% above that peak. On yield, framework-adjusted FCF (Company adjusted FCF less stock compensation) computes to 5.3% on FY2025 and 9.0% on the three-year average — reaching the 8-9% fortress band only on normalization and clearing the 10% moderate bar in no measured year [14] [15], so P3c is not_met.
Source: framework-adjusted FCF = Company adjusted FCF − stock compensation, divided by the $58.4B market cap; derived from FY2025 10-K non-GAAP reconciliation [16] and the share-based-compensation note [17]. Automotive net cash selects the 8–9% fortress reference; the 10% moderate bar is the framework default.
P3d (forward path) is met: CapIQ consensus forward FCF clears the bar within one to two years — FY2026 10.2%, FY2027 12.2% on the current market cap — and Ford's own FY2026 guidance corroborates it [18]. On the framework's own logic, a sell side that agrees the cash is there is normally a supportive signal. The missing ingredient is fear: the yield is compressing on recovery, not opening on capitulation. Full treatments: Dislocation, Yield.
Balance sheet and self-help (P4a–P4c) — can outlast, but no repurchase engine
P4a is met: the automotive book carries $7.7B of net cash and $49.8B of liquidity against a light maturity ladder, up-streaming cash from Ford Credit rather than drawing on it [19] [20]. The counter-fact: consolidated total debt is roughly $163B against $36.0B of equity — headroom exists only because Ford Credit's $141.4B book is ring-fenced and match-funded [21]. P4b is not_met: the buyback flywheel does not exist — roughly $1.9B of repurchases over a decade, all anti-dilutive, none in 2025, and a flat share count (3,999M in 2016 to 3,979M in 2025) [22]. The count is not rising, so this avoids the SBC/M&A hard-fail, but there is no net-retirement engine to turn a dislocation yield into per-share compounding. P4c is not_met: the ~4.1% dividend is covered at mid-cycle yet consumed ~86% of a compressed 2025 adjusted FCF, and Ford suspended it entirely in early 2020, reinstating at a reduced $0.10 only in late 2021 [23]. Full treatment: Self-Help.
Diagnosis (P5) — leans temporary, but no price to act on
The independent trial put the probability the December-2025 EV reset is temporary at 0.64 (mean 0.62, spread 0.06, not contested). Ford's own 8-K caps total cash expenditures at ~$5.5B against ~$19.5B of charges — the rest is a non-cash write-off of loss-making EV capacity [24] [25]. The FY2025 net loss was almost entirely a $(17,356)M pre-tax special item, while operating cash flow rose to $21.3B and adjusted EPS was $1.09 [26]. The counter-fact under the permanent reading is real — warranty accruals climbed to $17,190M, Model e still lost money, and structural taxes on the ICE pool imply a $15-20B NPV haircut [27]. Either way the framework's setup is absent: the stock rose through the charge, so there is no price overreaction to harvest. Full treatment: Damage Math.
Instrument context (I1) — not_verifiable
The tally records I1 as not_verifiable: long-dated LEAPS (to the January 2028 expiry) and current implied volatility (30-day mean 34.4%, below the ~50-55 reference line) were observed on 2026-07-31 per the Clock tab, but a clean, dated open-interest figure from a single citable source was not captured, so the criterion could not be verified to the framework's standard. It is moot here: I1 never blocks the pillar verdicts, and the overall outcome is already fixed by the P1 gate.
What a 3x-in-3-years would require
The framework's target test — the price at bar-yield on normalized adjusted FCF, and what consensus would have to concede — cannot be rendered as arithmetic for Ford. The tally records re-rating math as unavailable because the applicable bar or normalized adjusted FCF is missing: fit_features.adjusted_fcf, adjusted_fcf_yield, and yield_baseline are all not_computable (a captive-finance artifact — the consolidated cash-flow feed does not isolate automotive capex), so no deterministic normalized-adjusted-FCF-at-bar figure exists to publish.
The base-rate context the framework substitutes comes from Ford's own history, on the Clock tab: since 1999 the 2011 ($18.79), 2014 ($17.84) and 2022 ($25.19) peaks were each followed by declines of 53%, 78% and 56% that set lower bases never regained. Today's $14.68 remains ~42% below the 2022 high. The one recent recovery (the 40% fall from $14.55 in July 2024 to $8.69 in April 2025) round-tripped only to its prior local peak, not to a new high. That is the pattern any 3× thesis would have to break, stated as fact.
Contested and undetermined
Contested: X2 (promotion pattern). The exclusion requires both prongs — a repeated promise-versus-delivery gap across the transcript archive and weak insider economic ownership — and the jury split cleanly, two votes not_met and two votes met (cross-family disagreement). The hit reading: Ford's 2023 EV plan (an 8% EV margin, a near-term EBIT-positive path) was abandoned and Model e breakeven pushed to 2029 [28] [29], and no director or officer owns more than 0.16% of the stock [30]. The not-a-hit reading: near-term forecasting has firmed — the two FY2025 adjusted-EBIT guides were met and the FCF guide beaten — and the Ford family's 40% Class-B voting control anchors the company to a long horizon rather than to quarterly EPS [31]. The name-mask probe read X2 as not_met (a hit), which is what flips it away from the unmasked contested reading and drives the prior_driven_risk flag. This split does not change the overall outcome — the P1 gate and the X1 exclusion already determine it.
Undetermined: none. No criterion resolved to cannot-determine; every pillar returned a verdict.
Provenance
Source: ruchir/fit_tally.json provenance block and ruchir/trial/tally.json.
Two model families staffed the jury; on the deciding gate (P1) they agreed unanimously, so the verdict itself was not close even though confidence is held low. Confidence is low for a separate reason: the blind name-mask probe read the promotion-pattern exclusion (X2) differently from the named run, which flags the possibility that a prior about "Ford the car company" — rather than the evidence alone — is doing some of the work on that one criterion.
Falsifier ledger
These are the standing what-would-change-this conditions carried from the tally. The first five are the framework's template falsifiers; the remainder are the diagnosis trial's flip conditions, each with its threshold, direction, and window where defined.
- adjusted FCF or EBITDA declines where flat-or-better was underwritten
- revenue declines for a third consecutive year
- capital allocation pivots to debt paydown over repurchases
- share count inflects upward
- the industry repricing cycle fails to materialize where industry-wide mean reversion was underwritten
- Ford Blue + Ford Pro EBIT keeps falling into FY2027 after tariff and Novelis-aluminum items clear, showing the ICE core is in structural (not supply-shock) decline.
- Operating cash flow drops sustainedly below the mid-teens $B or adjusted FCF turns negative, showing cash earning power (not just GAAP optics) is impaired.
- Model e losses persist near $4-5B beyond 2026 instead of shrinking toward breakeven, so the 'amputation' fails to stop the drain.
- Warranty/field-service accruals keep climbing above ~$18B, confirming quality is a rising structural claim on future cash.
- FY2026 adjusted EBIT or adjusted free cash flow is cut below the raised $10B and $6B lower-bound guidance levels or misses them materially.
- Model e losses remain above about $4B annually after the discontinued F-150 Lightning and cancelled programs are removed from the run rate.
- Ford Blue plus Ford Pro EBIT fails to recover above about $11B after Novelis-related temporary aluminum costs roll off.
- Additional EV cancellation, BOSK, warranty, or supplier cash charges exceed the disclosed cash-expenditure and excess-cost ranges or recur into FY2027.
- FY2026 adjusted EBIT lands below ~$10B or 2027 EBIT is guided down, showing the raises were premature and core earning power is eroding.
- Ford Pro + Ford Blue EBIT keep falling into FY2027 after the Novelis/tariff items roll off, indicating structural (not one-time) margin loss in the ICE profit pool.
- Operating cash flow drops materially below the ~$15-21B band or adjusted FCF turns negative, and consensus FY2027 EPS revisions turn sustainedly negative.
- Post-reset Model e / restructuring keeps consuming cash beyond the disclosed ~$5B (H1-26) with warranty/field-service accruals rising above ~$18B rather than normalizing.
Data gaps
- The consolidated cash-flow feed carries operating cash flow but no capital-expenditure line and does not isolate automotive capex from Ford Credit's finance flows, so
fit_features.adjusted_fcf,adjusted_fcf_yield,yield_baseline,fcf_stability,float_retirement_yearsandbalance_sheet_classare all not_computable; the yield and durability reads were rebuilt by hand from Ford's disclosed Company adjusted FCF and the sector balance sheet. - CapIQ's consolidated free-cash-flow metric ($2,296M FY2025) does not reconcile to Ford's Company adjusted FCF ($3,513M), a captive-finance artifact; the forward consensus yields are on the vendor basis and only approximately comparable to the hand-built adjusted-FCF yields.
- Enterprise value is not a clean denominator because consolidated net debt (~$125B) is Ford Credit's match-funded book, so market cap is used as the price-damage denominator (automotive net-cash detail sits in the Yield tab).
- Official reported short interest returned zero rows and the insider Form 4/5 feed records no calendar-2025 transactions, so neither a forced-seller setup nor insider selling through the drawdown can be evidenced.
- Consolidated China revenue as a precise percentage of total is not separately disclosed (China sits within "All Other" and most activity is equity-method); exposure is inferred as small from the 1.3% share and the revenue-exclusion policy.
- Options open-interest and liquidity at a granular strike/expiry level were not verifiable from a single dated citable source; long-dated LEAPS and current IV were verified (AlphaQuery, 2026-07-31), but a clean dated open-interest figure was not captured.
Business
Ford Motor Company is a US-listed global automaker — NYSE-traded common stock, about $58 billion of market value on the 31 July 2026 close, $187.3 billion of 2025 revenue. It clears both universe lines (US listing, size well above $10 billion). It is also, precisely, a car company: the one industry the framework excludes by name. It sells roughly 4.4 million vehicles a year into a fragmented, price-taking market, holds 13.2% US share, and carries a unionized cost base. China exposure is immaterial and shrinking; it is no consensus darling.
Where it sits in the universe (U1, U2)
Ford trades on the New York Stock Exchange as common stock under the ticker F, alongside a small, family-held Class B line convertible into common [1]. It is a Delaware corporation headquartered in Dearborn, Michigan — not a foreign issuer, not an ADR, and not Chinese-domiciled [2]. On geography (U1), it screens cleanly in.
On size (U2), the deterministic feature file marks a $58.4 billion market capitalization — 3.979 billion shares at the 31 July 2026 close of $14.68. That is roughly six times the $10 billion universe floor. (For scale reference, the 10-K cover records the common float at $42.4 billion on 30 June 2025 at a $10.85 price; the stock has since risen.) U2 clears comfortably.
Both universe screens pass: US-listed common stock on the NYSE, market capitalization roughly $58 billion against the $10 billion floor. The screen that bears on this company is an exclusion, not the universe — see the exclusion section below.
What Ford is, from zero
Ford designs, builds, and sells cars, trucks, SUVs, and commercial vehicles under the Ford and Lincoln brands, and finances their sale through a captive lender. As of December 2025 it employed about 169,000 people worldwide and ran the business through three vehicle segments plus Ford Credit [3]. In 2025 it sold approximately 4,395,000 vehicles at wholesale worldwide [4].
The three vehicle segments split the same product line by powertrain and customer [5]:
- Ford Blue — gas and hybrid Ford and Lincoln vehicles sold to retail customers; the legacy profit base.
- Ford Model e — electric vehicles and vehicle software; the segment that carries the EV investment and its losses.
- Ford Pro — the same vehicles sold to commercial, government, and rental fleets, bundled with financing, telematics, and service; the profit engine.
Ford Credit is a captive finance company — retail installment loans, leases, and dealer floorplan financing — earning primarily from interest and lease income [6].
Segment economics
The segment structure exposes the shape of the business plainly: a profitable commercial arm and a profitable finance arm are subsidizing a legacy retail business under pricing pressure and an electric business losing several billion a year.
Sources: FY2025 10-K, Company Key Metrics and segment tables [7] [8].
Ford Pro produced $6,843 million of adjusted EBIT on $66.3 billion of revenue — a 10.3% margin, the highest in the group. Ford Blue, the largest revenue segment at $101.0 billion, earned $3,024 million (a 3.0% margin, down from 5.2% a year earlier as volume, tariff costs, and exchange pressed on it) [9]. Ford Model e lost $4,806 million even as unit volume rose from 105,000 to 178,000 [10]. Ford Credit added $2,557 million [11].
Rolled up, 2025 Company adjusted EBIT was $6,780 million on $187.3 billion of revenue — a 3.6% adjusted margin. The GAAP result was a net loss of $8,182 million, driven entirely by $17,356 million of pre-tax special items, of which $10,657 million was a Model e asset impairment and EV program cancellations and $3,173 million a China joint-venture (BOSK) disposition [12]. Adjusted diluted EPS was $1.09; GAAP diluted EPS was a loss of $2.06 [13]. The distinction between that reported loss and the underlying operating result is the Damage Math question, not this tab's.
Scale and geography
FY2025 Revenue
Market Cap (31 Jul 2026)
Employees
Vehicles Sold (wholesale)
US Market Share
Price / Sales
Sources: FY2025 10-K — revenue and segment tables [14], employment [15], wholesales [16], US share [17]; market cap and Price/Sales derived from fit_features.market_cap and reported revenue.
Revenue and assets are North America–weighted. The United States alone booked $122,574 million of 2025 revenue — 65% of the total — and held $44,994 million of long-lived assets, roughly 68% of the group's $65,828 million [18]. Canada, the United Kingdom, and Mexico follow; all remaining countries together contributed $35,384 million.
Source: FY2025 10-K, Geographic Information note [19].
Market structure — the durability raw material (P1)
This is the evidence the Durability tab and the jury will lean on, so it is laid out to the page here rather than asserted.
Structure: fragmented and competitive, not concentrated. Ford holds 13.2% of the US market — its largest and most profitable — up from 12.4% in 2023, in an industry of about 16.7 million units [20]. It competes across that market against General Motors, Toyota, Stellantis, Honda, Hyundai-Kia, and Tesla — the major automakers whose filings sit in this run's peer set. No single manufacturer holds a share that would make this a duopoly or a tight oligopoly; it is a fragmented, many-player market.
Pricing power: absent, by the company's own description. Ford calls the automotive industry "a highly competitive business that has a wide and growing variety of product and service offerings from a growing number of manufacturers," and states its share depends on how its products are perceived "in comparison to those offered by other manufacturers based on many factors, including price, quality, styling, reliability, safety, fuel efficiency" [21]. Its risk factors go further: the global industry is "intensely competitive, with installed manufacturing capacity generally exceeding current demand," which historically forces incentive spending that Ford is "not necessarily able to set our prices to offset" [22]. This is the language of a price-taker competing on product amid chronic overcapacity, not a business that sets terms.
Capital intensity: real, but not an entry moat here. Automotive capital expenditure ran about $8.2 billion in 2025, and the business is heavily plant- and tooling-intensive. Capital intensity protects capital-heavy essentials only where it deters entry; here it has not — Ford flags "new types of competitors" entering its areas of strength, and notes that "Chinese electrified vehicle producers are exporting their products to some key markets in which we operate" [23]. Ford is itself writing off billions of EV capacity [24]. The capital is a cost of staying in, not a wall against newcomers.
Cost base: unionized and contractually rigid. About 56,300 US hourly employees are represented by the UAW, and roughly 99% of unionized US hourly workers are covered by collective bargaining agreements; recent UAW and Unifor contracts "resulted in significant cost increases," and the filing notes some competitors operate without such agreements [25]. Labor cost is structurally higher than for non-union rivals and cannot be flexed down quickly.
Operating history: long. Ford traces to a Michigan company incorporated in 1903 and has operated continuously since, incorporating in Delaware in 1919 [26]. Longevity is genuine — the one durability factor Ford clearly satisfies. It does not, on its own, offset a fragmented structure and absent pricing power.
Revenue trajectory: not in structural decline. Revenue has risen from $136.3 billion in 2021 to $187.3 billion in 2025, with no consecutive-year declines; the deterministic feature file records zero consecutive decline years and no three-year high-single-digit fall [fit_features.revenue_trajectory]. The disqualifier for P1 — three straight years of high-single-digit revenue decline — does not apply.
Source: derived from reported financials, FY2021–FY2025 10-Ks [27]; revenue trajectory per fit_features.
The market-structure record is two-sided: a 120-year-old, essential, capital-heavy business whose product people will keep buying (durability positives), set against a fragmented industry with no pricing power, excess capacity, a growing roster of entrants, and a rigid union cost base (durability negatives). The Durability tab weighs whether that combination supports high conviction that both revenue and free cash flow are higher in year ten.
Exclusion screen
Only the checks the corpus can settle at this stage are run here. The promotional-CEO test (X2) and the structural-decline distinction (X3) belong to Self-Help and Durability.
X1 — automobile manufacturer: a direct hit
Ford is an automobile manufacturer — the framework's single named industry exclusion. The evidence above is what that exclusion is built on: a highly competitive, fragmented market; no pricing power; excess capacity and new entrants; a business that screens cheap on cash-flow yield yet competes away its returns. Ford's own 2025 numbers show the pattern — the legacy retail segment's margin fell to 3.0%, the electric segment lost $4.8 billion, and the group posted an $8.2 billion GAAP loss on EV write-downs [28]. X1 is met on its face; the Fit tab carries what that means for the framework.
X4 — consensus darling: not met
Ford is the opposite of a saturated darling. Its market capitalization of $58.4 billion sits against $187.3 billion of revenue — a price-to-sales multiple of about 0.31x, a fraction of the multiple-to-sales that flags a story stock. The reported result is a GAAP loss, sell-side tone is skeptical rather than adoring, and the chart is not a bottom-left-to-top-right ascent. Whatever excludes Ford, it is not that consensus already owns the story. X4 is clean.
S1 — China dependence: immaterial and shrinking
China is a small and declining part of Ford, and largely off the consolidated books. Ford's China market share fell to 1.3% in 2025 from 1.8% in 2023, on about 0.4 million units in a 26.9 million-unit market [29]. Most China activity runs through unconsolidated joint ventures — Ford owns 32% of the publicly-traded JMC, which assembles Transit, Ranger, and SUVs in Nanchang [30]. Revenue from Ford-badged vehicles produced by unconsolidated affiliates, and from JMC-brand vehicles, is explicitly excluded from Ford's reported revenue [31], and Ford disposed of its BOSK China JV interest in 2025 at a $3.2 billion loss [32]. China is a sensitivity flag by construction, but a minor one here — consolidated revenue exposure is small and falling.
Source: FY2025 10-K, Sales, Industry Volume, and Market Share [33].
What this tab establishes
Ford is inside the universe on both lines — a $58 billion NYSE common stock, US-domiciled — and outside the framework's exclusion set on darling positioning and China. It is inside the exclusion set on the one that matters for a car maker: X1. The market-structure evidence — 13.2% share in a fragmented, price-taking, over-supplied industry with a rigid union cost base, set against a 120-year history and a still-growing top line — is handed forward for the Durability, Yield, and Fit tabs to weigh.
There was a dislocation — but it is fifteen months stale and has fully reversed. Ford fell 23.8% from a $11.40 peak (25 Nov 2024) to an $8.69 trough (8 Apr 2025), a fall whose acute leg was the April 2025 auto-tariff shock and whose confirmation was a suspended full-year outlook. Volume ran 3.05× its pre-fall median — real but moderate emotion. As of 31 Jul 2026 the stock is $14.68, 29% above the old peak. There is no live dislocation to buy today.
The drawdown, quantified
The framework's source of record — fit_features.capitulation_gauge — dates the fall precisely: peak $11.40 on 25 Nov 2024, trough $8.69 on 8 Apr 2025, a depth of −23.8% over 134 days. That is a real, entry-condition-sized drawdown. The problem for the framework is what happened next: the stock round-tripped the entire fall and kept going. At the last close of $14.68 (31 Jul 2026) it sits +68.9% off the trough and +28.8% above the pre-fall peak — near its highest levels since the 2021–22 recovery.
Peak — 25 Nov 2024
Trough — 8 Apr 2025
Current — 31 Jul 2026
Source: fit_features.capitulation_gauge.drawdown; prices from data/prices/daily.json, as reported.
Source: month-end closes, data/prices/daily.json, as reported. Peak $11.40 (Nov 2024) → trough $8.69 (Apr 2025) → $14.68 (Jul 2026).
The fall came in two distinguishable pieces. A slow drift carried the stock from the November peak down to roughly $9.55 by February 2025 on company-specific worries — a Q3 2024 profit that fell about 26% on a ~$1 billion write-off for a cancelled electric SUV, 4,000 announced European job cuts, and a soft initial 2025 outlook. Then a sharp event leg hit in early April 2025: from $10.15 on 2 Apr the stock dropped to the $8.69 trough on 8 Apr — roughly −14% in a week — as the U.S. auto-tariff announcement repriced the whole sector. The trough is a tariff-panic low, not the drift low.
The trigger
The dated, primary-document trigger is the April 2025 tariff shock and Ford's response to it. On its Q1 2025 report, Ford suspended full-year 2025 guidance, telling investors it estimated a gross adverse adjusted EBIT impact of about $2.5 billion and a net adverse impact of about $1.5 billion for 2025 from tariffs [1]. Management repeated the figures and the suspension on the earnings call the same day [2]. That withdrawal — the mechanism was policy, not demand — is the identifiable adverse event.
The drift that preceded it was ordinary bad news, not a repricing event: the initial 2025 guidance issued 5 February 2025 was for adjusted EBIT of $7.0–8.5 billion and adjusted free cash flow of $3.5–4.5 billion [3], a solid outlook that alone did not crack the stock. Separating the two matters: a stock down ~16% from peak to February on write-offs and layoffs is drift; the tariff week is the moment.
Crucially, the moment resolved. By the Q2 report (30 July 2025) Ford had reinstated guidance at adjusted EBIT of $6.5–7.5 billion and adjusted free cash flow of $3.5–4.5 billion, absorbing a net tariff headwind of roughly $2.0 billion (≈$3.0 billion gross, ~$1.0 billion of recovery actions) [4]. The feared hole was smaller than the April tape implied, and the price recovered accordingly.
The fear gauge
fit_features.capitulation_gauge.volume_spike measures 3.05× — the peak 20-day average volume inside the fall against the median daily volume in the 180 days before the peak. That is genuine emotion but not a washout: through the acute April week daily volume ran 200–275 million shares against a ~60-million baseline (roughly 3–4× on the worst single days), then subsided.
Source: monthly average daily volume, data/prices/daily.json; spike multiple from fit_features.capitulation_gauge.volume_spike.
Two features temper the "capitulation" read. First, the volume elevation sits at and after the trough (the heaviest months are Mar–Apr 2025 and, later, the Oct 2025 earnings response), consistent with forced macro de-risking rather than a single terminal flush. Second, 3.05× is well short of Ford's true panic history (its all-time volume spikes run 6–10× in 2008–09). This was orderly-to-emotional tariff repricing, not existential fear.
Who was selling
There is no identifiable forced or informed seller in the record — and no usable short-interest series.
- Short interest is a data gap. The official/public short-interest feed returned zero reported rows for Ford;
latest.jsoncarriesstatus: unavailableand the run explicitly warns that daily short-sale flow must not be read as outstanding short interest. I cannot quantify the short position or its change through the fall. - Insiders show no selling into the fall — but the feed has a hole. The Form 4/5 index records no transactions at all dated in calendar 2025, so it offers no evidence of insider selling (or buying) during the drawdown; the only recent open-market purchase is a director's ~$149k buy in June 2026 at $14.05. Treat the 2025 blank as missing data, not as confirmed inactivity.
- The seller was the market. The trough coincided with a broad tariff-driven equity selloff, and Ford — 3.98 billion shares, dominated by index and ETF ownership — fell with its sector on a macro mechanism. The evidence points to broad-based, macro-driven de-risking, not a company-specific liquidation.
Estimates vs price
The April fall carries the framework's signature — price outran fundamentals — but only briefly, and the estimates then moved the other way. Through the drawdown Ford kept beating: Q4 2024 revenue came in +4.9% vs consensus (reported 5 Feb 2025) and Q1 2025 revenue +4.6% (reported 5 May 2025), even as the stock hit its low. Subsequent quarters beat by more — Q2 2025 EPS +11.1%, Q3 2025 EPS +25.4%. The price cut, in other words, ran ahead of any earnings cut; the tariff hit that finally landed (~$1.5–2.0 billion net) was a fraction of the ~$10.8 billion of market value the drawdown erased ($2.71 per share × ~3.98 billion shares).
Forward consensus now points up, not down: consensus_forward_yield shows mean free-cash-flow estimates of $5.96 billion for FY2026, $7.11 billion for FY2027, and $7.99 billion for FY2028 against the current market cap — 10.2%, 12.2% and 13.7% implied yields. FY2027 normalized EPS has been revised higher over the last 90 days ($1.85 → $1.90). Estimates falling ahead of price is the setup the framework wants; here estimates are rising while the price sits near its highs — the opposite configuration.
Bottom line — no live dislocation
Honesty is the point of this tab, so plainly: Ford is not dislocated today. A real, dated, tariff-triggered drawdown of −23.8% did occur between November 2024 and April 2025, with 3.05× volume and a suspended-then-reinstated outlook — but it is fifteen months old and has completely reversed. The stock trades 29% above its pre-fall peak, forward estimates are rising, and the feared damage proved manageable. Even the more recent wobbles (a −18% dip to $11.54 in March 2026 on recalls; a spike to $17.44 in May 2026 on a Q1 beat) round-tripped. The framework's entry condition — something went wrong recently and fear is still in the price — is not met. What the Damage Math and the trial must weigh is a past shock, not a present opportunity.
Damage Math
Ford booked one of the largest charges in its history in December 2025 — about $19.5 billion of pre-tax EV write-downs and restructuring, roughly $14 billion of it non-cash [1] [2]. The share price never fell on it: at $14.68 the stock sits 29% above its pre-event peak. This tab shows, in arithmetic, that the numerator (cash-earnings damage) is small and the denominator (price damage) is absent — the reverse of a dislocation setup.
The near-term hit — a GAAP crater over intact cash earnings
The FY2025 headline was a net loss of $8,182 million and diluted EPS of $(2.06) [3]. The whole of that swing was one line: pre-tax special items of $(17,356) million, against $(1,860) million the year before [4]. Below the special items, the operating business did not deteriorate on a cash basis: operating cash flow rose to $21.3 billion, up $5.9 billion year over year, and Company adjusted free cash flow was $3.5 billion [5]. Adjusted EPS was $1.09 and adjusted net income $4,399 million [6].
Source: FY2025 Annual Report (Form 10-K), Results of Operations [7] and Liquidity and Capital Resources [8].
Consensus behaved the same way. Analysts modeled the charge as GAAP-only from the start: the Street's FY2025 GAAP EPS estimate was $(2.30) — worse than the $(2.06) reported — while its normalized EPS estimate held at $1.13 against the $1.09 delivered. Forward normalized estimates did not cut through the event and have since risen: FY2027 normalized EPS moved from $1.81 at the start of February 2026 to $1.90 now, up 4.6% over 180 days, and FY2026 normalized EPS sits at $1.86.
Source: consensus estimates, CapIQ vintage as of 2026-07-31 (data/sp/estimates.json).
The company's own guidance moved up, not down, across 2026. On the Q1 2026 call, Ford raised full-year adjusted EBIT guidance to $8.5–10.5 billion and adjusted free cash flow to $5–6 billion [9]. By the Q2 2026 print it raised again — adjusted EBIT to $10.0–11.0 billion and adjusted free cash flow to $6.0–7.0 billion, with Q2 adjusted EBIT of $2.5 billion, up 17% [10] [11]. The numerator of any damage calculation — the fall in forward cash earning power around the trigger — is therefore near zero, and on some measures positive.
The price/EV move — no drawdown to attribute
The market-cap side of the ledger shows no matching wound. Ford's drawdown ran from a peak close of $11.40 on 2024-11-25 to a trough of $8.69 on 2025-04-08, a fall of 23.8% — and that leg pre-dates the December 2025 impairment by eight months, driven by the early-2025 tariff shock, not the EV reset. The current close of $14.68 is 28.8% above the pre-drawdown peak and 69% above the trough. Market capitalization is $58.4 billion on 3,979 million shares.
Peak close (Nov 2024)
Trough close (Apr 2025)
Current close (Jul 2026)
Market cap ($B)
Source: daily price feed (data/prices/daily.json); market cap derived from 3,979M shares × $14.68 (data/ruchir/fit_features.json).
Enterprise value is less useful here than for most companies. Ford's consolidated balance sheet screens as heavily levered — roughly $125 billion net debt — but that debt is Ford Credit's match-funded book against $146 billion of finance receivables, not a claim on the automaker; on an automotive basis Ford holds net cash of about $6.5 billion (detailed in Yield). So market cap, not consolidated EV, is the honest denominator, and it moved up through the entire episode.
The NPV arithmetic — two scenarios, workings shown
The question the framework asks is whether a near-term hit was mispriced as a permanent loss of NPV. To size it, take Ford's mid-cycle cash generation and ask what the December reset does to it. Anchor normalized annual cash generation at $6.5 billion — the overlap of consensus free cash flow ($6.0 billion FY2026 rising to $7.1 billion FY2027) and Ford's own adjusted-FCF guidance of $6.0–7.0 billion [12]. Discount at 10%, reflecting the cyclicality and above-market beta of an automaker; assume zero real growth, consistent with a business whose revenue has compounded near 1% since 2016.
The reset's cash cost is disclosed and bounded. Of the ~$19.5 billion of pre-tax charges, only ~$5.5 billion is cash — about $0.5 billion for the BlueOval SK disposition and up to ~$5.0 billion of program-cancellation expenses, the majority in 2026 [13]. The remaining ~$14 billion is a non-cash write-off of assets that were losing money.
Source: Form 8-K, Material Impairments (Dec 15, 2025), anticipated charges and cash-expenditure table [14].
Scenario T — temporary (non-cash amputation). The write-down retires loss-making EV capacity, not earning power, and stopping the Model e drain is accretive. The only NPV cost is the ~$5.5 billion of one-time cash charges, worth about $5.0 billion discounted. Plausible NPV damage: roughly $5 billion, about 9% of market cap — with a positive offset the arithmetic below ignores.
Scenario P — permanent (structural erosion). The reset signals a durable tax on the internal-combustion profit pool: a warranty and field-service accrual that climbed to $17,190 million at year-end 2025 with up to $1.7 billion of reasonably possible excess [15], ongoing tariffs now sized at about $1 billion of run-rate cost [16], and a Model e segment guided to a ~$(4.0) billion loss that may never reach breakeven. Model that as a permanent $1.0–1.5 billion per year reduction in normalized cash generation. Capitalized at 10%, that is $10–15 billion, plus the $5 billion one-time — plausible NPV damage of $15–20 billion, about 26–34% of market cap.
Source: derived — normalized cash generation $6.5B at r=10%, g=0; one-time cash cost ~$5.5B from Form 8-K [17]; permanent haircut from warranty, tariff, and Model e drivers [18] [19].
The gap — absent, and inverted
The damage gap is price damage minus plausible NPV damage. Here the price damage attributable to the reset is essentially zero: the stock rose through the December 2025 charge and trades 29% above its pre-event peak. Plausible NPV damage is positive under both readings — about $5 billion if temporary, $15–20 billion if permanent. So the gap runs the wrong way: –$5 billion to –$20 billion, meaning the market has priced in less value loss than even the temporary case implies, not more.
The Damage Math framework looks for price damage that exceeds plausible value damage — a temporary hit mispriced as permanent. Ford's arithmetic is the inverse: a mostly non-cash $19.5 billion charge with a ~$5.5 billion cash cost drew no price damage at all. There is no dislocation gap to harvest, whichever way the temporary-versus-permanent question is resolved.
This sits alongside the framework's hard exclusion of automakers, developed in Business and Yield: the absence of a fear-driven dislocation is a second, independent reason the setup is not present, not a restatement of the first.
The trial — temporary versus permanent, at full strength
The temporary-versus-permanent question was argued by two opposing corpus-cited briefs and ruled on by three independent judges. Both cases are strong.
The three judges put the probability the impairment is temporary at 0.64 (mean 0.62, per-judge range 0.58–0.64), and the ruling is not contested — reading order moved the mean by 0.03. The report carries that 0.64; nothing on this tab overrides it. Its practical meaning is narrow: it grades how the charge should be read, but because there was no price drawdown around the charge, neither reading produces a mispricing to act on.
Which line broke, and whether it self-corrects
The break is entirely in Model e, the EV segment. In FY2025 it lost $(4,806) million while Ford Blue earned $3,024 million, Ford Pro $6,843 million, and Ford Credit $2,557 million — the profitable core earned roughly $12 billion and one segment consumed nearly $5 billion of it [36].
Source: FY2025 Annual Report (Form 10-K), segment results [37].
The recovery mechanism is amputation: Ford cancelled three planned EVs and the current F-150 Lightning and is writing the capacity down [38], and the loss is already narrowing — $(777) million in Q1 2026 and $(919) million in Q2, guided to about $(4.0) billion for the year against $(4.8) billion in 2025 [39] [40]. The case against self-correction is that the drag migrates rather than clears: warranty accruals keep rising [41], tariffs are now a ~$1 billion run-rate cost [42], and Model e has yet to demonstrate a profitable quarter. The trial weighs those against each other at 0.64 temporary; the damage-math conclusion holds under either, because the price never repriced the charge in the first place.
Ford's real-economy cash yield rests on its own Company adjusted free cash flow — the automaker measure that strips out Ford Credit — because the consolidated cash-flow statement mixes a $141 billion finance book into every line. On that basis, framework-adjusted FCF (less stock comp, with corporate acquisitions ≈ 0) runs $6.4B / $6.3B / $3.1B across FY2023–25: a 5.3% current yield on today's $58.4B market cap, a 9.0% three-year average, sitting against a fortress-to-moderate reference band the name only reaches when normalized. Conversion is thin and falling.
Why the deterministic feature is blank
fit_features.adjusted_fcf returns not_computable — "no annual free cash flow or operating cash flow plus capex." That is not a data outage; it is the automaker-with-a-bank problem. Ford's consolidated operating cash flow of $21.3 billion in FY2025 is dominated by Ford Credit's $12.9 billion of financing cash flows, and consolidated investing activity carries $55.7 billion of finance-receivable "acquisitions" that are Ford Credit's loan book, not corporate M&A [1]. A blind OCF-minus-capex calculation on the consolidated feed is meaningless. So the yield here is built by hand from Ford's own disclosed automotive measure, with the workings shown.
The adjustment, line by line
Ford discloses Company adjusted free cash flow — operating cash flow excluding Ford Credit, less automotive capital spending, plus Ford Credit distributions — and reconciles it to GAAP operating cash flow in the 10-K [2]. The framework then subtracts stock-based compensation and the five-year average of acquisition spend. Ford is not a serial corporate acquirer — the finance-receivable purchases above are Ford Credit's operating book — so the acquisition adjustment is effectively zero, and the only meaningful deduction is stock comp, which the equity note reports as $356M / $411M / $418M [3].
Framework-adjusted FCF = Company adjusted free cash flow − stock-based compensation − 5-yr avg acquisitions (≈ 0). Company adjusted FCF and its GAAP reconciliation from the FY2025 10-K [4]; stock comp from the equity note [5].
The adjustment removes little — stock comp is under $0.5 billion against a multi-billion FCF base, and there is no acquisition premium to strip because the automaker does not roll up companies to manufacture growth. What the table does surface is the collapse from FY2024 to FY2025: adjusted FCF halved, from $6.3B to $3.1B, as adjusted EBIT excluding Ford Credit fell from $8.6B to $4.2B on EV losses, tariffs, and warranty [6].
The yield, three ways
FY2025 adjusted yield
FY2025 adjusted FCF ($M)
Adjusted FCF ÷ current market capitalization ($58,412M: $14.68 close × 3,979M shares, 2026-07-31) — fit_features.market_cap. Adjusted FCF derived as above from the FY2025 10-K [7].
- Current (FY2025): $3,095M ÷ $58,412M = 5.3%.
- Three-year average (FY2023–25): ($6,445M + $6,261M + $3,095M) ÷ 3 = $5,267M ÷ $58,412M = 9.0%.
- Baseline distribution:
fit_features.yield_baselineisnot_computablebecause the derivation needs a same-year adjusted-FCF series the feed could not build. Reconstructed by hand, the three usable years run 11.0% → 10.7% → 5.3% — the opposite of the fortress signature. There is no stable low baseline that suddenly jumped to a fear-level yield; instead a normal ~10–11% yield fell to 5.3% as FCF halved and the share price recovered. The stock closed at $14.68, above its November-2024 pre-drawdown peak of $11.40 and 69% above the April-2025 trough of $8.69 — the capitulation this framework hunts has already reversed. This is yield compression from recovery, not a dislocation.
Which bar applies
The balance-sheet class is not_computable in the feature file ("debt or cash missing for FY 2025") — again a captive-finance artifact, because Ford splits its debt into two very different books.
Automotive debt $21,919M and Ford Credit debt $141,417M from the debt note [8]; automotive cash $14,086M and marketable securities $14,347M from the sector balance sheet [9].
On an automotive basis, Ford is net cash: $28.4 billion of cash and marketable securities against $21.9 billion of debt — roughly +$6.5 billion, consistent with the $28.7 billion "Company cash" Ford reports and its investment-grade leverage target [10]. On a consolidated basis it screens deeply levered — ~$125 billion net debt — but that is Ford Credit's $141 billion book, match-funded against $146 billion of net finance receivables, self-liquidating rather than distressed.
Because the yield numerator (Company adjusted FCF) is an automotive measure, the consistent pairing is the automotive balance sheet — net cash — which points to the fortress reference band of ~8–9%. The arithmetic against that line:
- FY2025 current, 5.3% — roughly 270–370 bps below the 8–9% band.
- Three-year average, 9.0% — at the top of the band.
- Treating the name as moderate (the 10% default), which its cyclicality and thin conversion arguably warrant, leaves even the three-year average ~100 bps short and the current year ~470 bps short.
These are reference lines, not grades: the honest read is that Ford reaches the fortress band only on a normalized/average basis and clears the 10% moderate bar in no single measured year.
Normalized mid-cycle yield
Ford is meaningfully cyclical, so the current-year figure understates through-cycle cash generation. A mid-cycle normalization, with its assumptions stated so a skeptic can recompute:
- Window: FY2023–25, spanning one strong pair (adjusted EBIT ex-Ford Credit $9.1B, $8.6B) and one trough ($4.2B) [11].
- Assumption: average Company adjusted FCF over the window = ($6,801M + $6,672M + $3,513M) ÷ 3 = $5,662M; less average stock comp $395M = $5,267M mid-cycle adjusted FCF.
- Result: $5,267M ÷ $58,412M = 9.0% — same as the three-year average, at the top of the fortress band, ~100 bps under the 10% moderate bar.
A skeptic who normalizes on a downturn window (FY2020–22, which included a pandemic year and a FY2022 net loss) would land materially lower; one who weights management's FY2026 guidance of $5.0–6.0B adjusted FCF [12] lands at a $5.5B midpoint, less ~$0.45B stock comp = $5.05B, or 8.6%. The normalization is not fragile in direction — every reasonable window lands in the 8–9% band, none clears 10%.
The consensus check
CapIQ consensus free cash flow (vintage 2026-08-01, data/sp/estimates.json) is a consolidated vendor metric — it does not reconcile to Ford's Company adjusted FCF (the vendor's FY2025 figure of $2,296M sits below Ford's reported $3,513M on definitional differences), so it is a proxy, named as such. From FY2026 forward the two measures converge: the consensus FY2026 FCF of $5,957M tracks Ford's own $5.0–6.0B adjusted guidance closely.
CapIQ consensus mean free cash flow ÷ current market cap; fit_features.consensus_forward_yield, sourced from data/sp/estimates.json (snapshot 2026-08-01). Vendor FCF definition differs from Ford's Company adjusted FCF.
On the vendor's own basis, consensus forward FCF clears the fortress band immediately (FY2026, 10.2%) and the 10% moderate bar comfortably by FY2027 (12.2%). Even after a framework stock-comp haircut of ~$0.5B, FY2026 lands ~9.4% and FY2027 ~11.4%. So the sell side already models a recovery back above the bar within one to two years — normally the framework's "sell side agrees, buy side is merely scared" signal.
The path consensus is underwriting is explicit: EV losses in Ford Model e rolling off, tariff and warranty headwinds easing, and Ford Pro/Ford Blue holding. The mechanism is credible and management's guidance corroborates the first leg. What is missing is the setup this framework requires. The buy side is not scared — the stock is above its pre-drawdown peak, not 60–70% below it. Consensus clearing the bar on a forward basis, while the current price already reflects the recovery, is not a fear entry; it is a name trading roughly at fair yield. I put the probability that framework-adjusted yield sustains ≥ 10% (moderate bar) across the next one-to-three years at roughly 40–50% — it requires both the EV/tariff roll-off and no fresh cyclical downturn — and the probability it holds the 8–9% fortress band at ~65–70%. Neither is underwritten from fear; both from consensus already agreeing.
FCF conversion trend
Company adjusted FCF [13] ÷ total revenues ($176,191M / $184,992M / $187,267M) from the consolidated income statement [14].
Revenue rose every year — $176B → $185B → $187B — while cash conversion fell from 3.9% to 1.9%. Adjusted FCF converts under 4 cents on the revenue dollar even in good years and under 2 cents in FY2025: the automaker signature the framework flags as a value trap, where the top line grows and the cash does not follow. A deteriorating conversion line undercuts any levered-exception or flywheel case, and Ford's capital return already reflects it — shareholder distributions are formally targeted at 40–50% of adjusted free cash flow, so a shrinking numerator directly shrinks the return [15].
One framework fact sits above all of this and is set out in Business and Durability: Ford is a car company, the framework's named hard exclusion — undifferentiated, capital-intensive, with FCF conversion that this tab shows running at 2–4%. The yield arithmetic does not rescue that; on the numbers, the normalized yield reaches the fortress band only on average, clears the 10% moderate bar in no measured year, and arrives with conversion falling and no live dislocation to price against.
Durability — the year-10 question
The framework's one pure gate asks whether year-10 revenue and adjusted free cash flow will be higher than today with very high conviction. Ford does not fail it on the mechanical disqualifier — consolidated revenue rose from $151.8B to $187.3B over ten years, so the three-consecutive-year decline flag is off. It fails on the affirmative conviction the gate demands. Ford is a car company: chronic excess capacity, no pricing power, an EV transition that has lost the Model e segment about $17.6B pretax in five years, and a self-defined "adjusted" free cash flow that nearly halved in 2025, to $3.5B. Genuine doubt on year-10 cash flow means the gate does not hold.
The year-10 gate is the framework's one binary test, and any proper doubt fails it. There is a genuine doubt here — not that Ford disappears, but that year-10 adjusted FCF is higher with the conviction the gate requires. This is stated once, in full, in the year-10 section below; the sections before it build the evidence on both sides.
The conviction sources, graded for Ford
The gate is passed by structural protection, not by good management. Ford has some of the raw materials — a century of history, an enormous asset base — but each source has to be graded for this company, and most do not carry the weight the framework needs.
Operating history — real, but survival is not a moat. Ford was incorporated in Delaware in 1919 and runs today as a global company of about 169,000 employees based in Dearborn, Michigan [1]. It has operated continuously through the Depression, numerous recessions, and the 2008–09 industry collapse, which it navigated without a federal bankruptcy filing. That longevity is genuine and rare. It is also the wrong test: the framework counts operating history as evidence of a protected position, and Ford's history is one of repeatedly out-executing in a business that offers no durable protection to the winner. Execution is not a moat.
Capital intensity — present, but it cuts both ways. Ford consolidated over 409 operations facilities across 27 countries as of year-end 2025, including 42 manufacturing and assembly plants [2]. The replacement cost of that base is a real barrier to a garage startup. But the framework prizes capital intensity because capital-heavy essentials survive — a pipeline, a rail network, a utility. Auto assembly capacity is the opposite: the industry carries structurally too much of it, and that surplus is the source of the price competition, not a wall against it.
Essentialness — the category, not the brand. Personal and commercial transportation is essential; a Ford is not. Vehicles are also durable goods — Ford states plainly that "consumers and businesses have latitude in determining whether and when to replace an existing vehicle" [3]. Essential-but-deferrable is the cyclical profile, not the utility profile the gate rewards.
Market structure — an oligopoly without oligopoly economics. Globally the industry is a handful of large makers, but it behaves as a fragmented price-taker's market, not a disciplined duopoly. Ford holds about 13.2% of the U.S. market (2025), up from 12.6% and 12.4% in the two prior years [4] — a stable but minority share that confers no pricing power. Ford describes "a very competitive pricing environment, driven in part by excess capacity," in which manufacturers "typically have offered price discounts and other marketing incentives" [5]. This is the Business tab's price-taker finding, and it is decisive here: monopoly/duopoly conviction does not apply.
Regulatory entry barriers — raise cost, do not protect share. Emissions, fuel-economy, and safety regimes make entry expensive, but unlike a bank charter or an insurance license they do not stop a qualified rival from taking Ford's customers — and the regulator is, if anything, forcing capital toward an unprofitable transition rather than shielding the incumbent. This is the opposite of the insurer/bank pattern the framework leans on.
None of the five sources carries the gate for Ford. The one that comes closest — capital intensity — is compromised by the fact that the industry's capital is chronically in surplus.
The structural threats, hunted
The named, quantified threat: the shift to electric vehicles is being led by Tesla and low-cost Chinese producers, and Ford's own electric segment loses money at scale. Ford Model e posted a 2025 EBIT loss of $4,806M on $6,670M of revenue — a -72.1% margin — and has now lost roughly $17.6B pretax across 2021–2025.
Source: Ford Model e segment EBIT; FY2024–FY2025 per FY2025 Annual Report [6], earlier years from Ford segment disclosures.
This is the framework's "your margin is my opportunity" test made concrete. The profit that funds Ford — Ford Blue (gas and hybrid) and Ford Pro (commercial) — is being competed for by entrants who do not need Ford's cost structure to make the product. Ford states that producers with "the ability to compete are entering the market … Chinese electrified vehicle producers are exporting their products to some key markets in which we operate" [7], and that "the global automotive industry is intensely competitive, with installed manufacturing capacity generally exceeding current demand" [8]. It also concedes it has "observed lower-than-anticipated industrywide EV adoption rates" [9] — a two-edged fact: it slows the near-term bleed, but the transition is where the year-10 competitive map is being redrawn, and Ford is losing money on the vehicles that define it.
The threat is not only Model e. Ford Blue — the internal-combustion cash engine — saw EBIT fall from $5,269M (5.2% margin) in 2024 to $3,024M (3.0%) in 2025 [10]. The engine that pays for everything is thinning while the transition it is meant to fund keeps losing money.
Source: FY2025 Annual Report, Segment Results [11]; Ford Blue [12].
The second threat is cyclicality. Vehicles are deferrable durable goods sold into "economic conditions over which we have little control" [13]. A recession compresses volume and, with fixed plant costs, EBIT and cash disproportionately — visible in the near-zero operating results of 2020. Cyclicality alone is survivable; the framework tolerates volatile FCF. What it does not tolerate is cyclicality layered on top of secular substitution and no pricing power, which is Ford's combination.
The disqualifier check (X3)
The specific disqualifier — revenue declining high-single-digit for three consecutive fiscal years after long existence — is not triggered. fit_features.revenue_trajectory records consecutive_decline_years = 0 and three_year_hsd_decline = false. Consolidated revenue has trended up, with only pandemic-year interruptions.
Source: derived from fit_features.revenue_trajectory (company filings, as reported); FY2025 figure per FY2025 Annual Report.
So X3 is checked and absent at the consolidated level, and that is stated plainly: on the framework's own structural-decline test, Ford does not fail. The honest caveat is that the flag measures total revenue, and Ford's total is buoyed by the Ford Pro build-out and by Model e revenue that is growing while losing money; the internal-combustion franchise underneath is in slow secular retreat. The flag is clean; the disqualifier does not carry the case either way.
FCF consistency (P2)
The deterministic feature is unavailable: fit_features.fcf_stability and adjusted_fcf are both not_computable — the structured cash-flow feed carried operating cash flow but no capital-expenditure line, so the profile could not build the adjusted-FCF series (recorded as a data gap below). The right substitute is Ford's own disclosed figure. Ford defines Company adjusted free cash flow as automotive operating cash flow excluding Ford Credit, net of capital spending; the reconciliation shows it at $6.8B (2023), $6.7B (2024), and $3.5B (2025), against GAAP operating cash flow of $14,918M, $15,423M, and $21,282M respectively [14].
Source: FY2023–FY2025 per FY2025 Annual Report reconciliation [15]; FY2026E is the midpoint of Ford's $5.0–$6.0B guidance [16].
Two observations bear on P2. First, the level is thin relative to the asset base and the market: $3.5B of adjusted FCF in 2025 against a $290B balance sheet and a $58B equity value, and Ford targets shareholder distributions of only 40–50% of it [17]. Second, and more to the point of consistency: adjusted FCF nearly halved in 2025, from $6.7B to $3.5B, and Ford's own 2026 guidance of Adjusted EBIT $8.0–$10.0B and Adjusted FCF $5.0–$6.0B [18] only partially recovers it, still short of the $6.7–$6.8B of 2023–2024. The framework welcomes an occasional negative episode when it is a business-model-inherent underwriting cycle (insurers, banks) on a 5–8 year cadence. Ford's negative and near-zero cash years are recession-driven and transition-driven, not a healthy cyclical mechanism that justifies fat margins in the good years — the good years here are not fat. This is volatility without the compensating high-return upswing, which is a genuine mark against P2 rather than the healthy pattern the framework accepts. (The yield arithmetic against his bar is developed in Yield; the balance sheet and buyback capacity in Self-Help.)
The year-10 case, both ways
The strongest case that year-10 revenue and adjusted FCF are higher. Ford Pro is a genuinely differentiated, growing franchise: $66,286M of revenue and $6,843M of EBIT at a 10.3% margin in 2025 [19], built on fleet relationships, parts, and recurring software and telematics services that are stickier than a retail vehicle sale. Total revenue has compounded to a record. The installed base and dealer network are vast, the balance sheet is liquid, and adjusted FCF is positive and self-funding even while carrying the Model e losses. If Ford Pro keeps compounding, Model e losses are capped or reversed, and industry pricing stabilizes, both year-10 revenue and adjusted FCF can be higher than today.
The strongest doubt. This is a car company — the specific value trap the framework excludes, on the reasoning that autos are too competitive, undifferentiated, and burdened with excess capacity, screen cheap on FCF yield, and have not created durable shareholder wealth. Every structural fact above supports that: no pricing power at ~13% share, "installed manufacturing capacity generally exceeding current demand" [20], Chinese entrants arriving [21], a $17.6B five-year loss in the segment that carries the technology transition, a thinning ICE cash engine, and adjusted FCF that nearly halved in 2025 to $3.5B [22].
The read, once. Year-10 revenue higher is plausible. Year-10 adjusted FCF higher with very high conviction is not — the conviction sources the gate needs (durable pricing power, regulatory protection of share, capital intensity as a survival moat) do not apply, and the threats that would erode cash are named, structural, and already in the numbers. On a binary gate that any proper doubt fails, this is a genuine doubt: the year-10 gate does not hold for Ford. That is a legitimate conclusion, not a failure of the analysis — the framework is designed to exclude exactly this kind of business, and the arithmetic here says why.
Self-Help
Ford can comfortably outlast a downturn: the automotive balance sheet carries net cash of $7.7B, $49.8B of liquidity and a $20B cash-floor policy, while captive Ford Credit debt is self-liquidating and separately funded [1]. The engine the framework needs is missing: buybacks are negligible, the share count is flat, and cash returns run entirely through a dividend that management suspended in 2020.
The balance sheet against the problem's duration
Ford runs two balance sheets stapled together. The industrial company (Ford excluding Ford Credit) held $28.7B of cash and $49.8B of liquidity at year-end 2025 against $21.0B of debt — net cash of $7.7B — and states a standing policy to keep Company cash at or above $20B "to be prepared for an economic downturn and other stress scenarios" [2]. On that measure the company can outlast a multi-year problem without capital allocation being forced toward debt paydown.
Company Cash ($B)
Company Liquidity ($B)
Auto Net Cash ($B)
Auto Debt ($B)
Source: FY2025 Annual Report (Form 10-K), Liquidity and Capital Resources, Company excluding Ford Credit [3].
The consolidated picture looks far more levered — total debt of roughly $163B against $36.0B of equity — but $141.4B of that is Ford Credit's book, matched against finance receivables and operating leases and funded in its own name through unsecured and asset-backed markets. Ford Credit distributed $1.65B up to the parent in 2025 rather than drawing on it, so its leverage is a funding structure, not a corporate solvency claim on the automaker [4]. The credit book carries its own cyclical loss exposure, which belongs to the durability question (Durability), not to whether the automaker can pay its bills.
The maturity ladder confirms the industrial company faces no refinancing wall. Automotive maturities are $5.6B in 2026 — of which $2.3B is a zero-coupon convert and $1.7B a low-coupon 2026 note — then trivial amounts ($1.2B, $0.8B, $0.5B, $0.7B) through 2030, with $13.5B pushed beyond. Ford Credit's ladder is heavy and front-loaded ($51.8B in 2026), but that is the normal cadence of a finance subsidiary that continuously re-terms its receivables.
Source: FY2025 Annual Report (Form 10-K), Note 18 Debt and Commitments — Debt Obligations [5].
The public unsecured debt is investment-grade with a long weighted maturity — coupons and tenors running out to 2043, 2059, 2062 and one 1997-vintage debenture due 2097 [6]. Pension is close to fully funded (a $0.2B global net deficit) and OPEB is $4.4B unfunded — real but not a near-term cash call [7]. On outlast-ability the answer is unambiguous: the industrial balance sheet has the headroom.
The repurchase record — executed, not authorized
Here the framework's premise breaks. The buyback flywheel — repurchases converting a high yield into per-share compounding — requires a company that actually retires stock. Ford does not. Cash spent on repurchases over the last decade totalled roughly $1.9B, none of it in 2020, 2021 or 2025, and every dollar of it characterised as offsetting the anti-dilutive effect of share-based compensation rather than shrinking the float. Ford "completed no share repurchases during the fourth quarter of 2025" [8].
Source: derived from FY2016–FY2025 Consolidated Statements of Cash Flows; figures match fit_features.share_count_trend.buyback_cash_per_year.
The share count reflects it. Ford carried 3,999M shares at the end of 2016 and 3,979M at the end of 2025 — down half a percent across a full decade, essentially flat, with a small rise from 2020 to 2023 before the 2025 dip. That is not the rising-count-from-dilution pattern that fails the framework outright; it is stasis. But stasis is not the flywheel either. With no net retirement, even a 10% adjusted yield would not translate into 10% of EPS accretion, because the mechanism that would deliver it — shrinking the denominator — is absent. The adjusted-yield computation itself sits with the Yield tab; what matters here is that the company has never built the repurchase habit the pattern depends on.
Management's capital-return intent, from the record
Ford's stated policy is explicit and dividend-first: "We generally target shareholder distributions of 40% to 50% of adjusted free cash flow," delivered through "dividend payments and/or a share repurchase program (including share repurchases to offset the anti-dilutive effect of increased share-based compensation)" [9]. In practice the whole of that distribution has gone to dividends: 2025 shareholder distributions were $3.0B, "all of which was attributable to our regular and supplemental dividends" [10]. The buyback lever exists on paper and is used only to neutralise dilution.
Insider buying is thin but not absent: one director, John L. Thornton, bought 10,600 shares on the open market at $14.05 in June 2026 (about $149,000) [11]. That is the only open-market purchase in the recent Form 4 record; the rest is grants, option exercises and tax withholding.
The levered exception does not apply
The framework tolerates leverage only where the adjusted yield is very high (~25%+) and paired with a demonstrated multi-year share-count reduction and non-deteriorating FCF. Ford clears none of the three legs. Its cash-return capacity, measured on management's disclosed Company adjusted free cash flow, ran $6.8B (2023), $6.7B (2024) and $3.5B (2025) [12] — against a $58.4B market capitalisation, an adjusted-FCF yield near 6% on 2025 and roughly 10% on the three-year average, nowhere close to 25%. And the share count is flat, not falling. This is a Charter-style exception on paper only; the arithmetic never reaches the door.
The deterministic feature adjusted_fcf is not_computable — the consolidated cash-flow feed does not isolate automotive capex from Ford Credit's finance flows. The figures above use Ford's own filed Company adjusted free cash flow, which excludes Ford Credit, as the automotive-level substitute [13].
The absurdity check
The deterministic float_retirement_years feature is not_computable for the same reason. Computed by hand from filed figures, the number is unremarkable: $58.4B of market cap divided by 2025's $3.5B of Company adjusted free cash flow is 16.7 years; against the three-year average of about $5.7B it is 10.3 years; against the midpoint of Ford's own 2026 guidance of $5.0–6.0B [14] it is roughly 10.6 years. The pattern's absurdity signal fires when the whole float retires in about three years; Ford sits three to five times that. The price is not making a claim that cannot survive — it is pricing a low-return, capital-intensive automaker at a modest yield, not a mispriced compounding machine.
Derived from market capitalisation of $58.4B (fit_features.market_cap) and Company adjusted free cash flow [15].
Dividend safety
The dividend is a material part of any Ford return case. The regular payout of $0.15 a quarter — $0.60 a year — is a 4.1% yield at $14.68, and Ford declared $0.75 a share in total for 2025 (a 5.1% trailing yield) after a $0.15 first-quarter supplemental [16]. Total declared has stepped down from $1.25 in 2023 to $0.78 in 2024 to $0.75 in 2025, the shrinkage entirely in the discretionary supplemental [17].
Coverage is adequate in mid-cycle but thinning. In 2024 the $3.5B distribution was 52% of $6.7B adjusted FCF, inside the 40–50% policy band; in 2025 the $3.0B distribution rose to about 86% of a compressed $3.5B adjusted FCF as auto earnings fell.
Sources: Company adjusted FCF reconciliation [18]; shareholder distributions, Changes in Company Cash [19].
The regular dividend alone — about $2.4B of cash — consumed roughly two-thirds of 2025's weak adjusted free cash flow, so the cushion narrows fast when auto earnings fall. And the record through downturns is the decisive fact: Ford suspended its dividend entirely in early 2020 and did not reinstate it until the fourth quarter of 2021, at a reduced $0.10 a share [20]. The 10-K risk factors state plainly that pension, OPEB or liquidity strain could force the company to "suspend dividend payments" [21]. What would force a cut is therefore concrete and has happened before: a demand-driven swing in auto adjusted EBIT toward the losses of 2020, or a Ford Credit stress event that stops the up-stream distributions. The dividend is safe at mid-cycle and demonstrably cyclical in stress — protected only after the balance sheet is.
One nuance on 2025: Ford reported a GAAP net loss (an EPS of −$2.06), but it was driven by large non-cash and special items rather than by cash burn — net operating cash flow was a positive $21.3B and Company adjusted free cash flow was $3.5B [22]. The dividend was covered on cash even in a loss year; the attribution of that loss belongs to Damage Math.
Management credibility
The promise-versus-delivery record is two-sided, and the divide runs between strategy and near-term guidance.
On strategy — the electric-vehicle plan — the record is a multi-year over-promise. On the Q3 2023 call, with Model e already running at roughly a $5B annual loss, management still defended an 8% EBIT-margin target for its second- and third-generation EVs and was pressed on the fact that "not that long ago, a few months ago, you still had fairly near-term targets to bring that to EBIT positive" [23]. Neither held. By the Q4 2025 call the language had reversed entirely — "We dealt decisively with the reality of the market and shifted our focus of our EV business to a high volume, affordable end of the market" — and Model e breakeven was pushed out to 2029 [24]. Big claims, repeated resets: the EV program is a clear instance of the promotional pattern the framework screens for.
Skin in the game is thin. No director, nominee or executive officer beneficially owns more than 0.16% of Ford's stock, and the directors and executive officers as a group hold 0.63% [25]. Farley's 2025 compensation of $27.5M was almost entirely stock awards granted, not stock bought. The counterweight is the Ford family, which holds Class B stock carrying 40% of general voting power through a voting trust — an entrenched, multi-generational control block that aligns the company to a long horizon rather than to next quarter's EPS, even as its economic stake is small [26] [27].
Against that sits a genuinely improved near-term guidance record. The two 2025 adjusted-EBIT guides ($6.5–7.5B, then cut to $6–6.5B after the Novelis aluminium fire) were met — full-year adjusted EBIT landed at $6.8B and adjusted free cash flow at $3.5B, above the $2–3B guide the company set mid-year. Management has raised 2026 adjusted EBIT guidance progressively toward $10–11B. So the operational forecasting has firmed even as the strategic promises have not. The net read: a promotional pattern is present on the long-dated EV and margin targets, with minimal executive ownership, partly offset by credible short-cycle guidance and family control — enough that the exclusion is a live concern for the Fit verdict rather than a settled one. Ford also sits inside the framework's automaker exclusion on its own terms — an undifferentiated, capital-intensive, excess-capacity industry — a question the Business tab adjudicates.
Clock
The instruments that matter here run 18 months and longer, so the question is what would make the market re-recognize higher intrinsic value in Ford, and roughly when. The honest starting point is that the fear moment already passed: Ford fell from about $14.55 in July 2024 to $8.69 in April 2025, then round-tripped to $14.68 by July 2026. The re-rating levers — tariff-cost normalization, a rebound off a loss-year base — are dated and real, but Ford's own record shows every major peak since 1999 set a lower base it never regained. Long-dated options exist and price calm.
The re-rating mechanism — what would close the gap, and when
Three dated levers could lift printed earnings from here. None is a vague "sentiment improves"; each has a calendar and a filing behind it.
Tariff-cost normalization. In 2025 Ford's gross tariff cost was about $3 billion, and the net EBIT impact about $2 billion after offsets; as of December 31, 2025 it carried a $974 million receivable for tariffs paid but not yet refunded, with relief subject to periodic U.S. Department of Commerce approval [1]. If refunds arrive and the 2026 run-rate falls, that is a mechanical tailwind to EBIT, not a demand call. The path runs through the 2026 quarters — the next print lands 22 October 2026 — and the FY2026 close in early 2027.
A low-bar reset off a loss year. FY2025 was a trough print: Ford reported a net loss attributable of $8.18 billion, against net income of $5.88 billion in 2024 [2]. The loss was concentrated in special items — $2.4 billion booked through 2025 for the cancelled three-row electric SUV program, with further EV-strategy charges pending [3] — plus lower fourth-quarter production from fires at aluminum supplier Novelis, which Ford expects to partially recover in 2026 [4]. Consensus reads these as transitory: FY2026 EPS is pegged near $1.81 against roughly $1.09 the year prior, a rebound of about 66%.
The counter-fact sits in the same filing. The BlueOval SK battery-JV disposition closes in the first half of 2026 and carries about $3 billion of additional special-item charges [5]. A low bar can be reset lower before it lifts.
A dividend anchor, not a buyback flywheel. Ford distributed $3.0 billion to holders in 2025, entirely through regular and supplemental dividends, and declared a $0.15 regular dividend on 2 February 2026 [6]. That payout supports a valuation floor while the operating levers play out. What is absent is the mechanism the framework prizes most: repurchases. Ford bought back no stock in 2025 and its share count has drifted up, not down — the arithmetic is in the Self-Help tab. Capital spending was $8.7 billion in 2025 and is guided to $9.5–10.5 billion in 2026 [7], so the cash goes to the plant, not the float.
Base rates from Ford's own history
Ford's long price record has one dominant feature: rallies return to prior local peaks, not to new highs. The chart below plots quarter-end closes since 2008.
Source: derived from the run's daily price history, 2008–2026 (quarter-end closes), as reported.
The four comparable drawdown episodes of the modern era are tabulated below. Each depth is measured from the episode's swing-high close to its lowest close; the arithmetic is recomputable from the same daily series.
Source: derived from the run's daily price history; depths and durations computed from swing-high to lowest close, as reported.
The pattern is the disqualifying one the framework flags for car makers. Ford's 2011 peak near $18.79, its 2014 plateau near $17.84, and its 2022 peak of $25.19 were each followed by declines that formed lower bases the stock never round-tripped; today's $14.68 sits about 42% below the 2022 high. The lone counter-example is the most recent episode: the 40% drop from $14.55 to $8.69 did recover, but only back to its own prior local peak — a range-trade, not the compounding round-trip the quality-monopoly precedents in the framework produce, where a name reclaims and exceeds its old high.
The 18-month test
There is no live dislocation for an 18-month instrument to time. The deterministic capitulation gauge measures the fear leg at a 24% drawdown with a volume spike of about 3.0x median — a real emotion-driven low in April 2025 — but that trough is 41% behind the current price. Measured from the July 2024 swing high, the same trough was a 40% fall; either way, it has reversed. Re-recognition of higher intrinsic value within 18–24 months would require the tariff and EV-writedown drags to roll off and the forward multiple — roughly 8x FY2026 consensus EPS — to expand and hold above its historical ceiling. Ford's own base rates argue against the second condition: the multiple has repeatedly compressed back after every rally. The read fails, in the framework's terms, if EBIT and FCF stop sliding and hold flat while the multiple re-rates durably — the industry-wide repricing that the Fit tab's falsifier ledger names, and which Ford's history has not delivered.
What consensus expects, and when
The sell side is not capitulated; it is at fair-value. The consensus price target sits at a $15.78 mean and $15.46 median, roughly 7% above the $14.68 close, inside a $11.00–$20.00 range across 20 estimates.
Source: consensus analyst price targets and current close, as reported in the run's estimates feed.
The recommendation split is 3 strong-buy, 5 buy, 13 hold, 1 sell — a consensus recommendation score of 2.5, squarely neutral. The buy side is not visibly scared and the sell side has not thrown in the towel; both sit near "fairly valued," which is the opposite of the capitulated-consensus setup the framework hunts. Estimate momentum is mildly positive: FY earnings estimates saw seven upward revisions against zero down in the trailing 30 days, and consensus free cash flow is modeled at roughly $5.96 billion for FY2026 and $7.11 billion for FY2027 (10.2% and 12.2% on the current $58.4 billion market cap). The candidate quarter for a printed recovery to show is the FY2026 close reported in early 2027 — the first full year in which tariff refunds and the absence of the 2025 EV charges could both land in the same statement. The nearer print on 22 October 2026 will mostly test whether the tariff run-rate is falling.
Instrument facts
Ford is among the most liquid single-name option markets in the United States, and long-dated listed contracts exist: options run out to the January 2028 LEAPS expiry, roughly 18 months beyond the current date, with active open interest across strikes. Implied volatility is low. AlphaQuery's dated readings for 31 July 2026 put mean 30-day implied volatility at 34.4% and mean 120-day implied volatility at 37.2% — a mildly upward-sloping term structure that sits below the framework's reference lines (up to roughly 50–55 acceptable, 60–70 elevated). The options market is pricing Ford as calm, consistent with a name whose fear low is already behind it. These are facts, not suggestions; no strike, expiry, or structure is implied.
Instrument facts: option-chain availability and implied-volatility levels are current web-sourced facts (AlphaQuery, dated 2026-07-31); they carry no filing page and appear in the manifest's uncited-material-claims list.